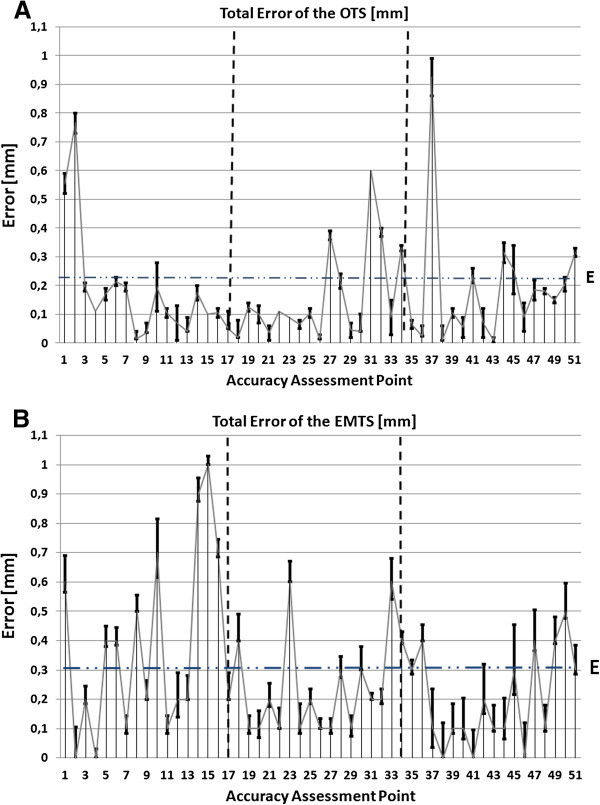
Figure 3.

A sequence plot representation of the errors for the OTS (A) and the EMTS (B). The first plot on each graph represents the first accuracy assessment point (point 1 on the bottom level) and the last plot the 51st point (the last point on the top level) of the phantom. The vertical bars represent the error interval at each point.
