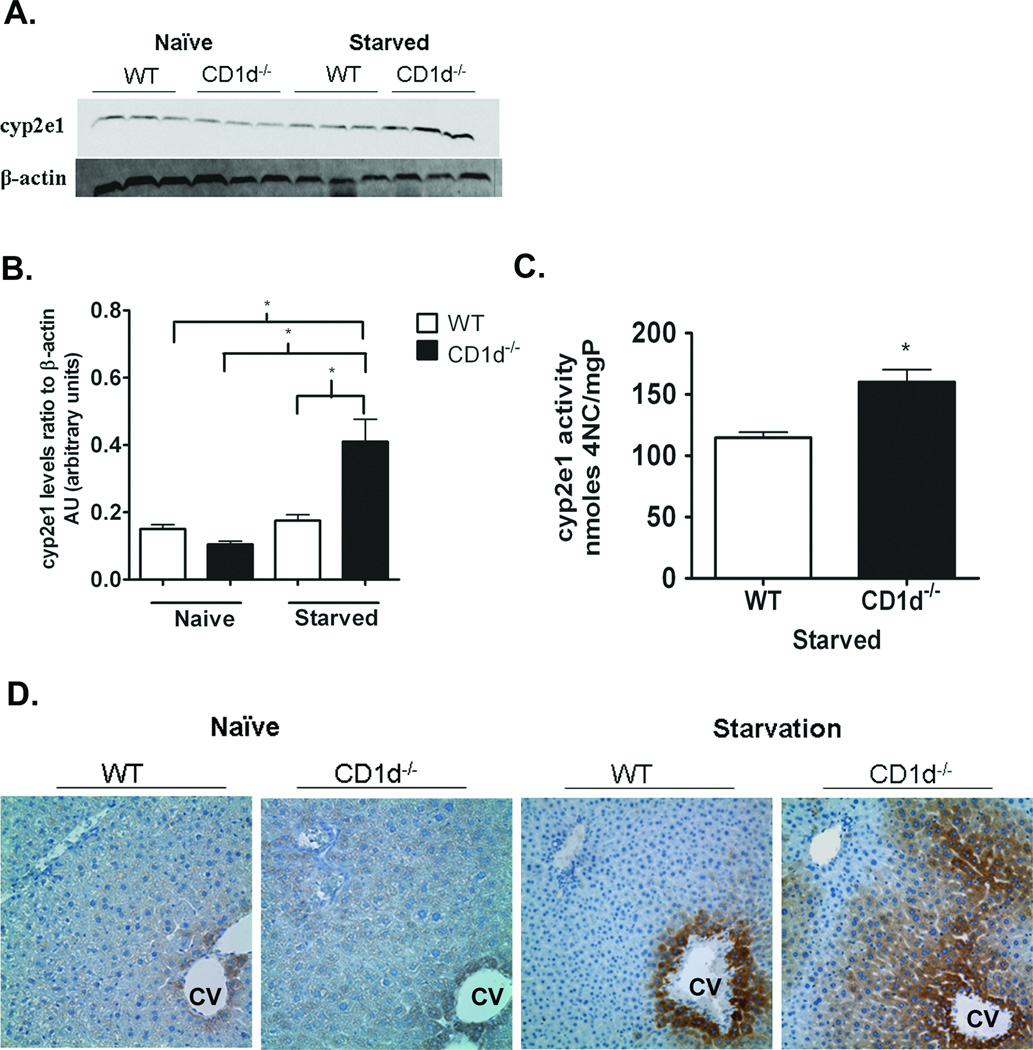
Figure 5. Increased CYP2E1 protein expression and activity in CD1d−/− mice compared to WT upon starvation.
A) CYP2E1 protein levels in female naïve and starved WT and CD1d−/− mice were detected in liver homogenates by immunoblot analysis with anti-CYP2E1 antibody (1:3000, Millipore, Billerica, MA). B) Quantification of CYP2E1 protein levels by densitometric analysis. C) CYP2E1 activity levels in female starved WT and CD1d−/− mice. D) Photomicrograph (400X final magnification) of CYP2E1 (1:1000) immunohistochemical staining of liver sections from naïve and starved female WT and CD1d−/− mice. CV, central vein. Results represent mean ± SEM of 3 mice per group. * p < 0.05 versus WT mice. Data shown are representative of three independent experiments.

