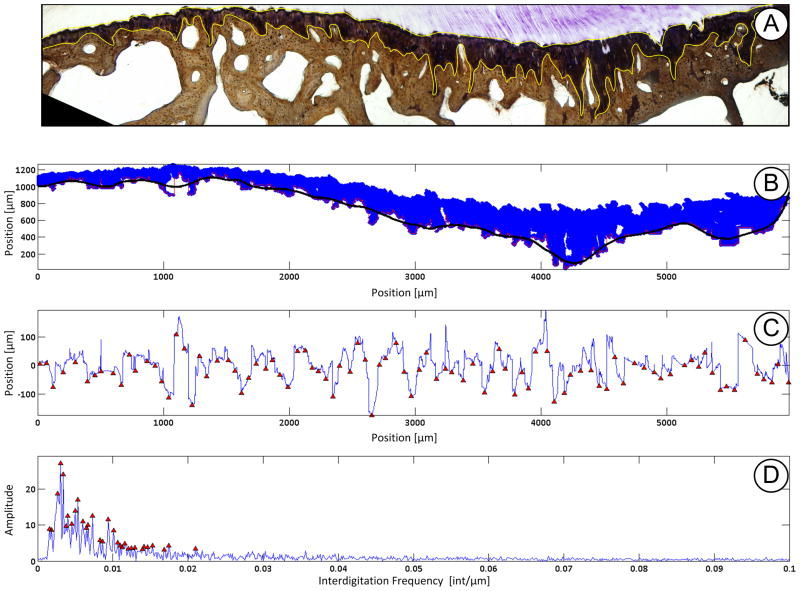
Figure 2.
Example of interdigitation analysis performed. A) To identify the calcified fibrocartilage (CFC) region the insertion site was stained with toluidine blue and counter stained using Von Kossa technique. The CFC region (outlined in yellow) was isolated using the ImageJ color deconvolution tool. B) Pixel locations were loaded into Matlab and a coarse Savitzky-Golay smoothing function is overlaid (black line) at the cement line between CFC and subchondral bone. C) The smoothing function was then subtracted from the pixels at the cement line yielding unique x,y coordinates representing the interdigitations. Interdigitation size and average frequency was then computed using custom written scripts determine the nearest neighbor peak/valley pairs. Size is the height difference between pairs. Average frequency is the total number of interdigitations determined along the insertion site. D) A fast Fourier transform was then applied to the data to determine the peak and high frequency of interdigitation.

