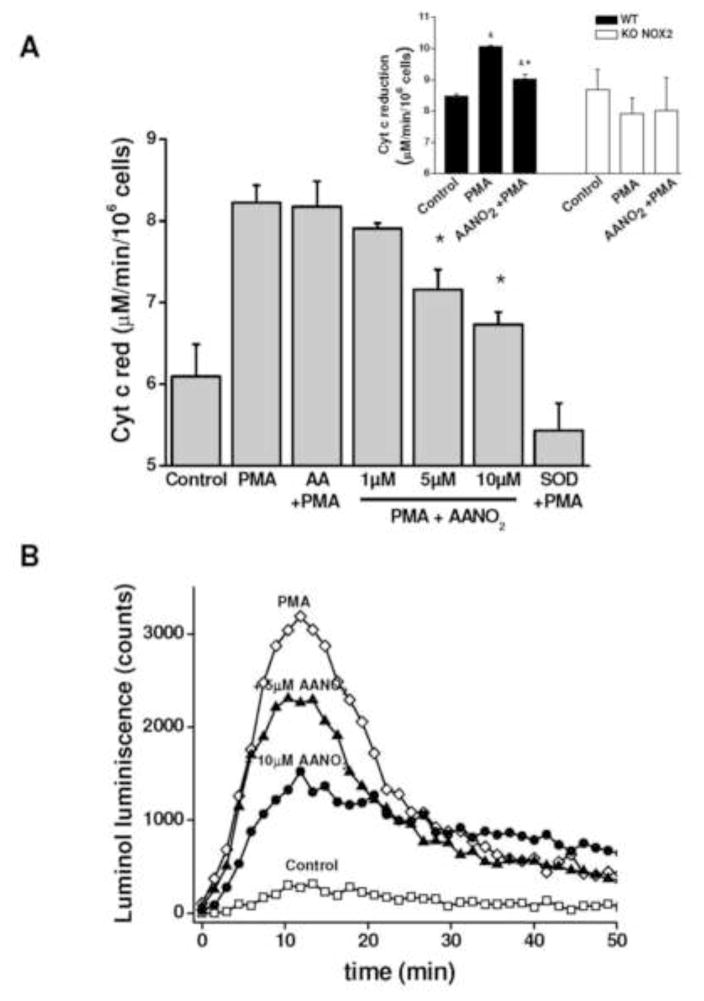
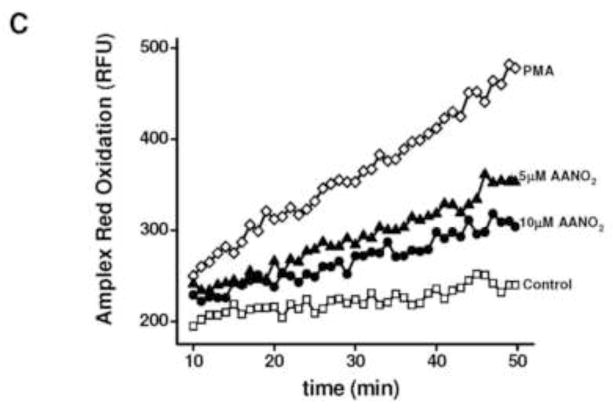
Figure 1. AANO2 inhibits O2·− production in activated macrophages.
The production of O2·− was analyzed in macrophages by cytochrome c reduction (A), Luminol chemiluminescence (B), and Amplex Red fluorescence in the presence of HRP (C). (A) J774A.1 macrophages (2×10⁵ cells) were treated with AANO2 (1, 5 and 10 μM) or AA (10 μM) for 15 minutes in dPBS buffer at 37°C, washed and activated for an additional hour with PMA (3 μg/ml) in the presence of 20 μM cyt c. The supernatant was collected and the levels of reduced cyt c due to O2·− were measured at 550 nm (ε= 21 mM−1. cm−1) [41]. A control with SOD (600 U/ml) was included. Results shown correspond to the mean ± SD, n=3. * indicates statistical differences compared to the PMA condition, p < 0.05. Inset: Macrophages from bone marrow of wt and gp91phox−/− mice were treated with 10 μM AANO2 for 15 minutes in dPBS buffer at 37°C, washed and activated for an additional hour with PMA (3 μg/ml) in the presence of 20 μM cyt c. Superoxide production was evaluated by the cyt c reduction assay. * indicates statistical differences compared to the control condition, p < 0.05; & indicates statistical differences compared to the PMA condition, p < 0.05 (B) J774A.1 macrophages (2×10⁵ cells) were treated with AANO2 (5 and 10 μM, -▲- and -●- respectively) and PMA (-◇-) as in (A). Luminol (100 μM) was added and the formation of O2·− was analyzed following oxidized luminol luminescence for 1hr. A control condition without PMA was also included (-□-). (C) Macrophages (-□-) treated with 5 μM (-▲-) and 10 μM (-●-) AANO2 in dPBS buffer at 37°C, were activated with PMA (3 μg/ml, -◇-). In this case, the formation of O2·− derived-H2O2 was evaluated by following the fluorescence of Amplex Red (50 μM) with 4 μg/ml HRP (λex= 515 nm, λem= 590 nm) in a fluorescence plate reader. Data shown in figures (B) and (C) are representative of at least four independent experiments.


