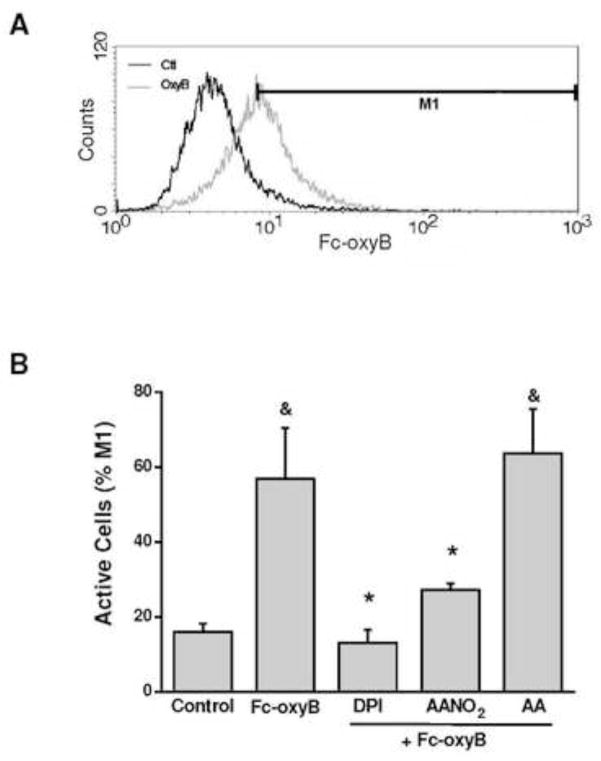
Figure 2. Flow cytometry analysis of NOX2 inhibition by AANO2.
J774-A1 macrophages (2×10⁶ cells) were treated with AANO2 (0–10 μM) or DPI (50 μM), a nonspecific NOX inhibitor. Cells were washed and treated with Fc-oxyBURST (Fc-oxyB, 50 μg/ml) for 1h, and fluorescence of DCF determined by flow cytometry. Representative histograms are shown in A and quantitative analysis of the obtained histograms was done (B). M1 region corresponds to the cell population which exhibits high fluorescence due to H2DCF oxidation to DCF by ROS. Results shown correspond to the mean ± SD, n=3. & indicate statistical differences compared to the control condition, p < 0.05; * indicate statistical differences compared to the non-inhibitor condition, p < 00.05.

