Figure 2.

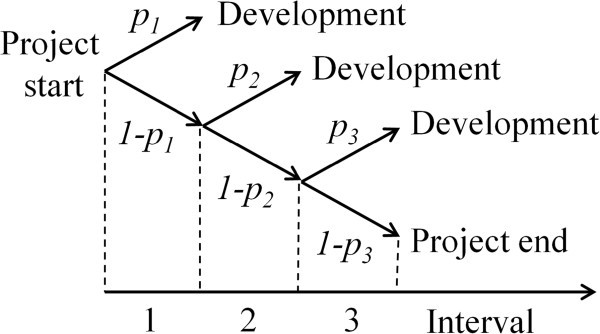
Probability tree diagram showing the possible scenarios in a drug discovery project conveying to Figure1, where the probabilities for success are different for the different periods.

Probability tree diagram showing the possible scenarios in a drug discovery project conveying to Figure1, where the probabilities for success are different for the different periods.