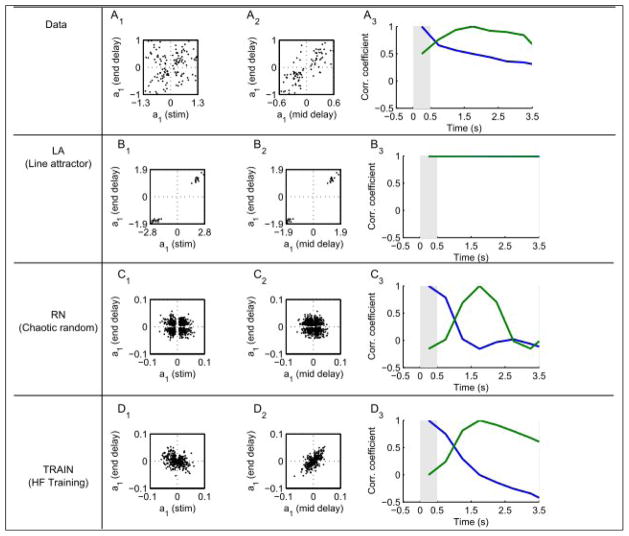
Figure 4.
Consistency of frequency tuning. Firing rates were fit according to r = a0 + a1 f1. Values of a1 at the end of the delay were compared to those during the stimulus (1) or mid-delay (2). 3 Correlation of a1 values across the population using either the stimulus (blue) or mid-delay (green) as a reference.

