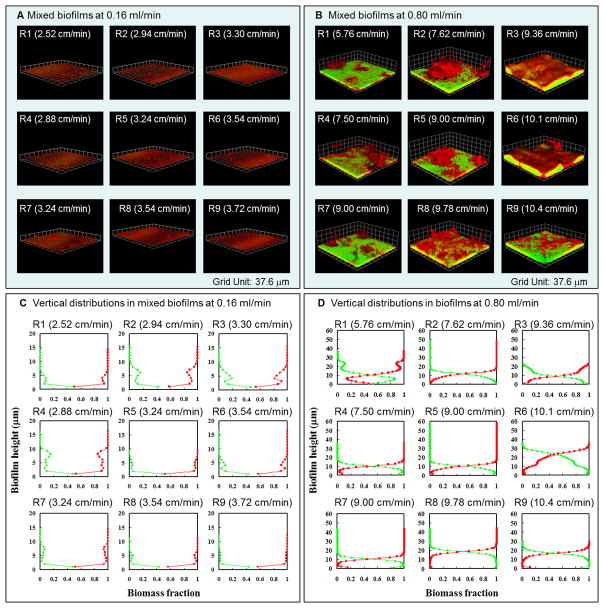
Figure 2.
Dual-species seven-day-old biofilms of Pseudomonas aeruginosa PAO1 (green) and Flavobacterium sp. CDC-65 (red) under inflow rates of 0.16 mL min−1 and 0.8 mL min−1. A) and B) show the representative biofilm morphology on the 7th day at each of the nine regions indicated in Figure 1C. Local velocities in each region are given in parentheses, and the grid unit is 37.6 μm. C) and D) show the representative vertical distributions of Pseudomonas and Flavobacterium at each region of the biofilm. Red lines represent the fraction of Flavobacterium and green lines represent the fraction of Pseudomonas.

