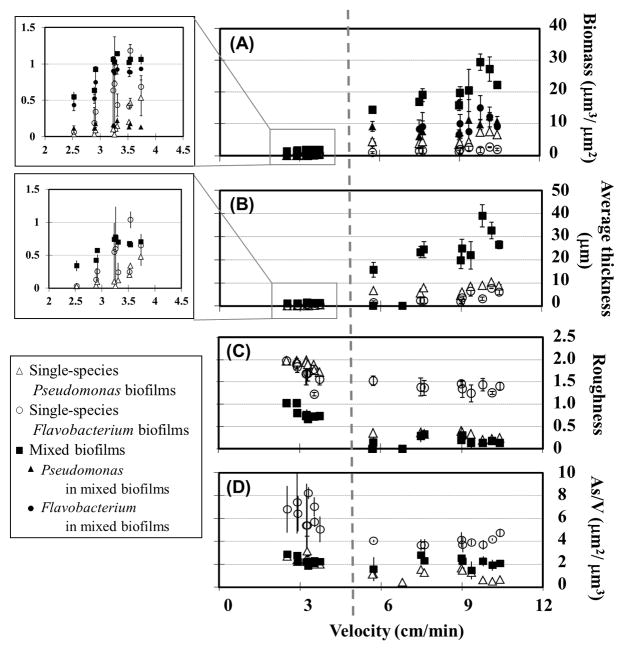
Figure 4.
Biofilm biomass and morphology as a function of local velocity in single- and mixed-species biofilms. Open symbols represent single-species biofilms of Pseudomonas aeruginosa PAO1 and Flavobacterium sp. CDC-65, and solid symbols represent mixed biofilms. A) Total biomass of single- and mixed-species biofilms, and biomass of each organism within mixed biofilms. B) Average thickness, C) Roughness and D) Surface-area-to-volume ratio (As/V) of single- and mixed-species biofilms. Plotted points and error bars represent the average and standard deviation of three replicate observations. Similar trends were observed in other experiments.

