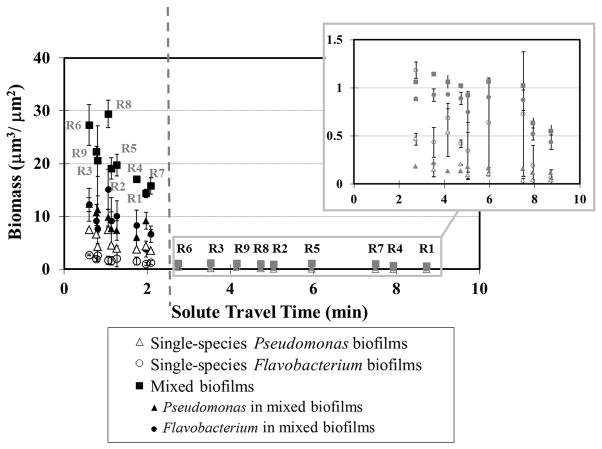
Figure 5.
Relationship between biofilm biomass and solute travel time from the flow-cell inlet to the observation locations. Open symbols represent single-species biofilms, and solid symbols represent mixed biofilms. Black icons show observations obtained under fast inflow rate (0.80 mL min−1), and gray icons in the inset show observations obtained under the slow inflow rate (0.16 mL min−1). Plotted points and error bars represent the average and standard deviation of three replicate observations. Similar trends were observed in other experiments.

