
Figure 11.
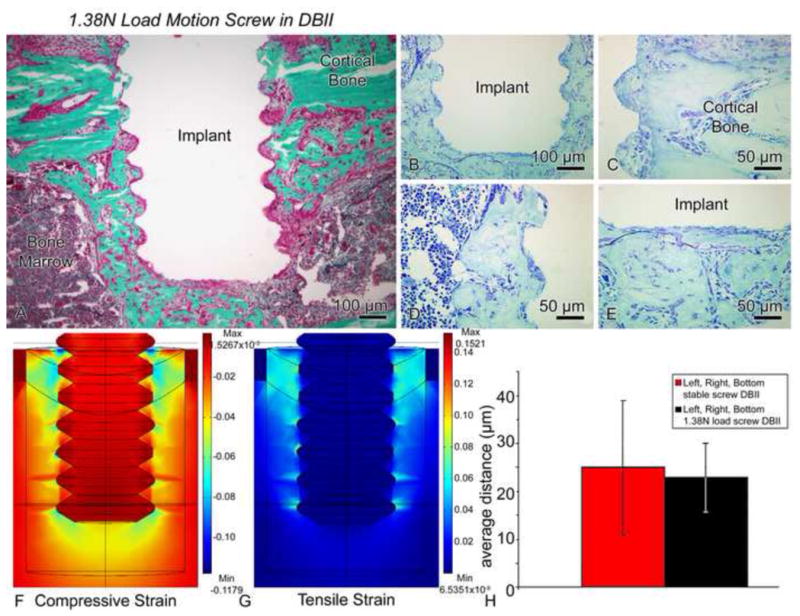
(A–E) Light micrographs of illustrating the histological appearance of screws that have been moved axially by only 17–70 μm (average of 43 μm) in a direct-bone-implant-interface (DBII) (1.38N load, group 9). Histological observations of Goldner (A) and toluidine blue stained sections (B–E) showed nearly direct bone-implant apposition around the threads (C–D) and beneath the base of the implant (E). (F, G) Compared to the situation in Figure 10, relatively small magnitudes of the principal compressive (F) and tensile (G) strains were predicted at the interfaces of the implants subjected to motion in this group. Due to expected damage from drilling etc., we used a Young’s elastic modulus for the bone adjacent to the implant that was 70% of the largest value that we measured in the healing interface, i.e., we used 11.9 MPa (= 0.7 × 17 MPa). (H) There was no difference in the bone-implant distance values for stable (group 7) vs. motion cases (group 9) (bars show 95% confidence intervals).