
Figure 6.
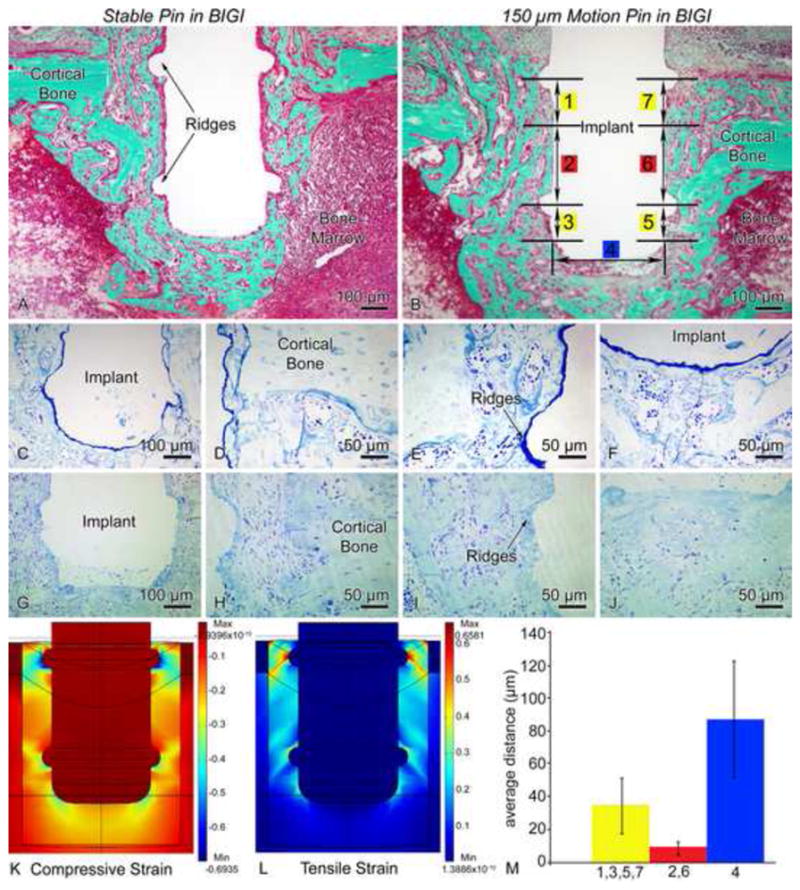
Light micrographs illustrating the histological appearance of (A, C–F) stable (group 1) and (B, G–J) 150 μm motion (group 2) pin-shaped implant placed in a bone-implant-gap interface (BIGI) for 7 days. Histological observations reveal that newly formed bone is present near the circumferential ridges (A, D–E) and beneath the base (A, F) of stable implants. In implants subjected to loading (B, G–J), some bone formation is noted in these high strain regions, but a granulation tissue consisting of fibroblasts, red blood cells and inflammatory cells can also be observed. Toluidine blue (C–J) stained semi-thin sections allow a better resolution of the interfacial tissue than what is observed in Goldner stained thick sections (A, B). (K, L) 3-D finite element predictions of principal compressive (K) and tensile (L) strains in the BIGI when the Young’s modulus of the BIGI had day 2 properties, i.e., 6.56 MPa (M) For pin-shaped implants moving 150 μm in the BIGI, the mean local bone-implant distance at high strain regions (circumferential ridges = 1,3,5,7 and base = 4) was larger than at the lower strain regions (smooth sides of the pin = 2,6) of the same pin (bars show 99% confidence intervals).