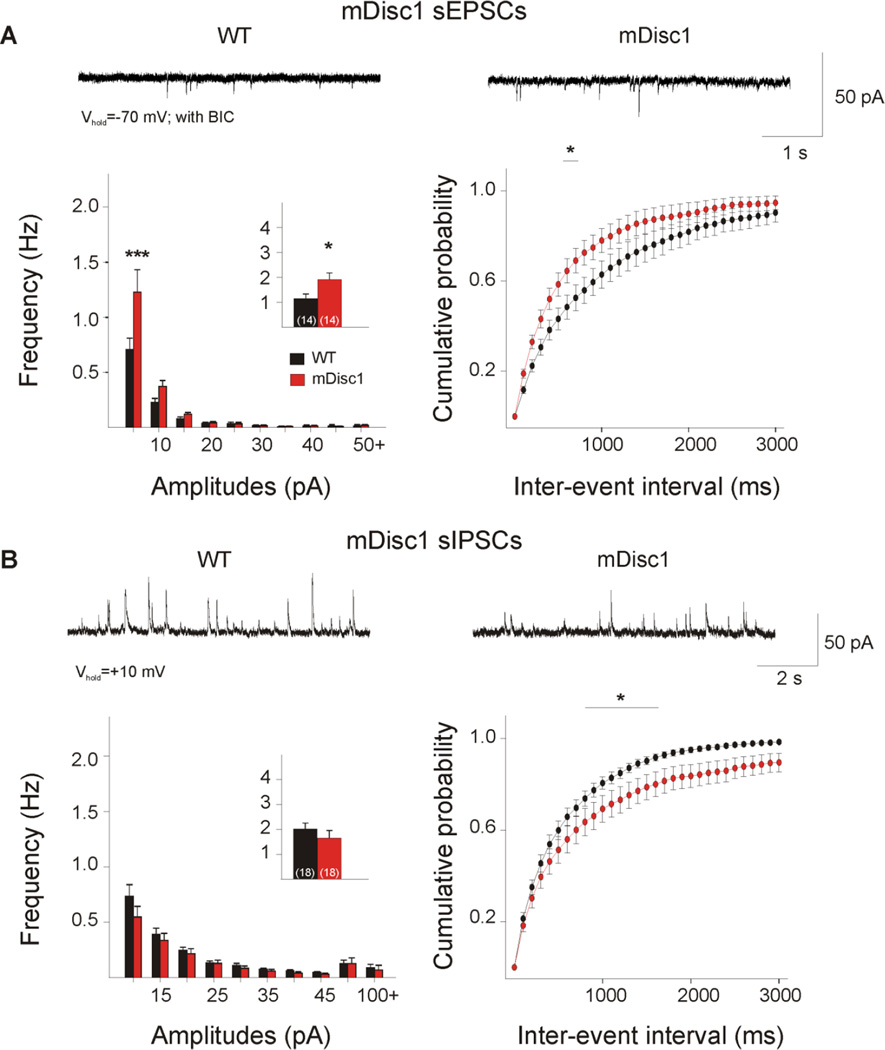
Figure 1. Glutamatergic and GABAergic synaptic activity in mDisc1 mice.
A. Typical voltage-clamp traces of sEPSCs recorded from cortical pyramidal neurons at −70 mV in the presence of 5 µM BIC. mDisc1 mice showed a significant increase in mean sEPSC frequency (inset) compared to WT mice. Amplitude-frequency histograms indicated a significant increase in small-amplitude events 5–10 pA (left panel). A significant difference was observed in the cumulative distributions of IEIs from 700–800 ms (right panel). B. Typical traces of sIPSCs recorded in ACSF at a holding potential of + 10mV. No significant differences were observed in mean sIPSC frequency or amplitude-frequency histograms. Significant differences occurred in the cumulative distributions of IEIs in the 900–1700 ms intervals. For this figure and subsequent figures, * signifies p<0.05; ** signifies p<0.01; and *** signifies p<0.001.

