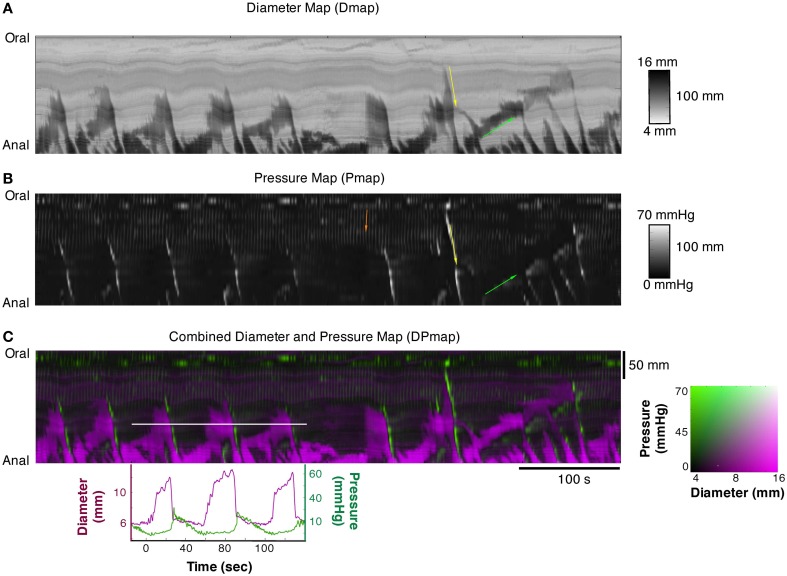
Figure 2.
(A) Diameter Map (Dmap); (B) Pressure Map (PMap); and (C) composite Diameter/Pressure Map (DPMap). In the Dmap (A) the dilated regions are shown as dark areas. Peristaltic propagating contraction can be seen at regular intervals (yellow arrow) originating predominantly around the mid-point of the specimen. Slowly propagating antiperistaltic contraction are also apparent (Green arrow). In the Pmap (B) the propagating contractions appear as white oblique lines (yellow arrow) and the anti-peristaltic propagating contractions are highlighted by the green arrow. In the proximal regions of the colon, a series of vertical gray lines can be seen in the PMap (Orange arrow). These cyclic changes in the pressure profile, that are not apparent in the Dmap, represent myogenic rhythmic activity generated by slow waves. In the composite DPMap (C) changes in diameter are shown as shades of magenta, while pressure is shown in shades of green. Below the DPMap traces of diameter (magenta) and pressure (green) extracted along the white line in (C) are displayed and show the relation between changes in diameter with the corresponding changes in pressure. In this example there are three increases in diameter, each of which coincide with a liquid bolus entering the region. Associated with the movement of the liquid are peristaltic propagating contractions. As each of these moves into the region of the white line the diameter of the gut decreases and the pressure increases. The relations between pressure and diameter provide the basis for the orbits displayed in Figures 4, 5.

