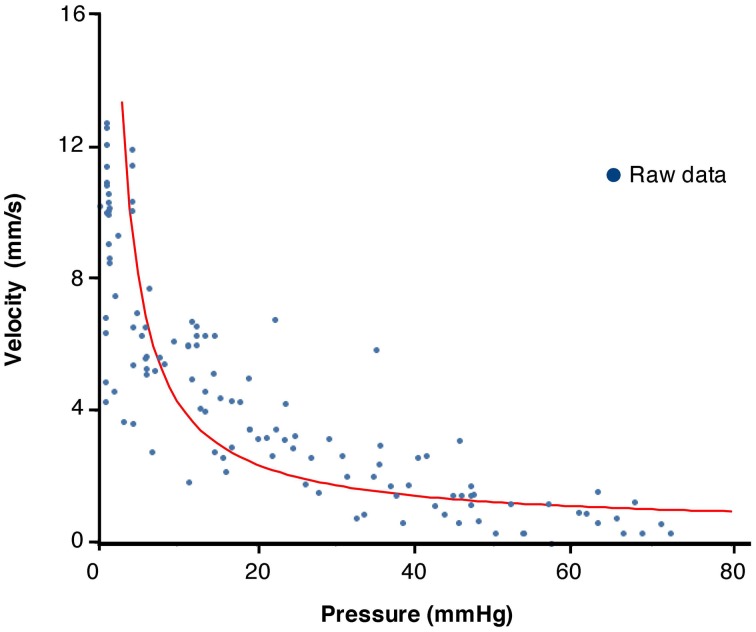
Figure 8.
Plot of values of velocity of contraction vs. pressure from 10 periods chosen from the composite DPMap in Figure 7 during isotonic to isometric contractions. The plotted values were fitted by a rectangular hyperbole according to the method described in the method section. The curve shows the expected inverse relation between pressure and velocity of contraction described originally by Hill.

