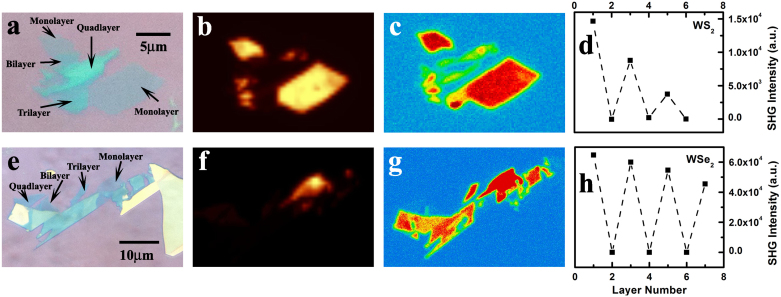
Figure 1.
(a) and (e): optical images of WS2 (a) and WSe2 (e) slabs on Si substrates with 300 nm SiO2 cap-layer; (b) and (f): photoluminescence images at direct gap transition energy of the corresponding WS2 (b) and WSe2 (f) slabs excited at 2.41 eV. Only monolayers are visible at the present contrast; (c) and (g): the corresponding SHG under a 800 nm excitation at normal incidence (150 fs, 80 MHZ) on WS2 (c) and WSe2 (g) respectively. The highest intensity labeled in red arises from monolayers. The SHG signal from the silicon/silicon oxide surface is negligible compared with those from multilayers; (d) and (h): The relative intensity of SHG as a function of the film thickness in WS2 (d) and WSe2 (h). The SHG shows an even-odd oscillation dependence on the layer number.

