
Figure 4. Hyperthermia.
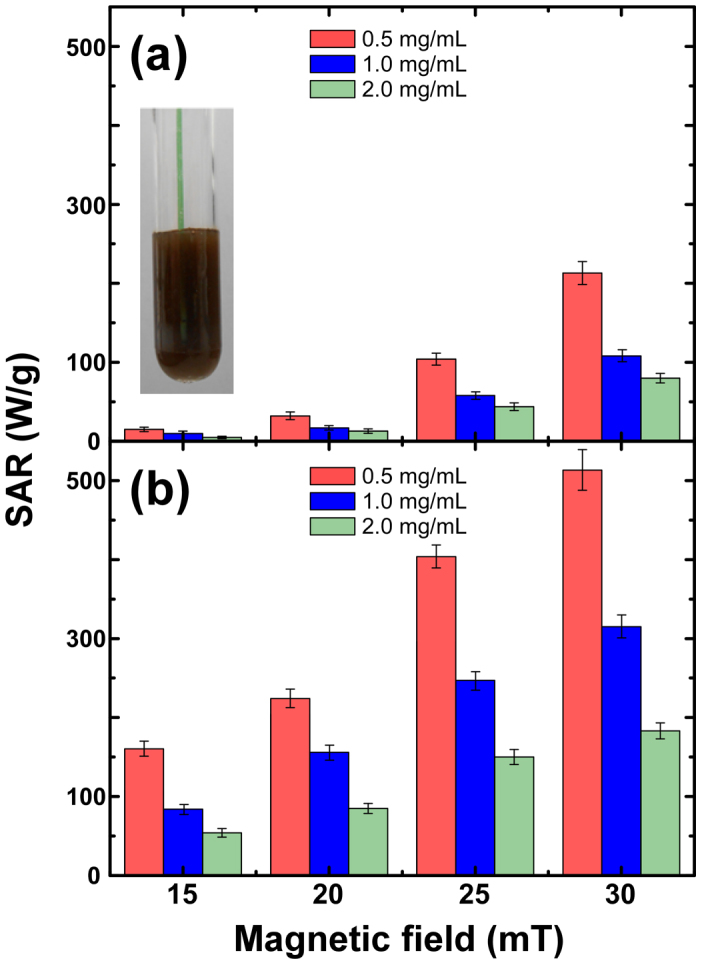
Specific Absorption Rate (SAR) for (a) 40 nm and (b) 20 nm iron oxide nanocubes extrapolated from experimental thermal response curves at different maximum applied magnetic fields (Figure S7 within the Supplementary Information). Data are expressed as the mean of 3 measurements ± the standard error of the mean. Inset shows suspension stability after measurement.