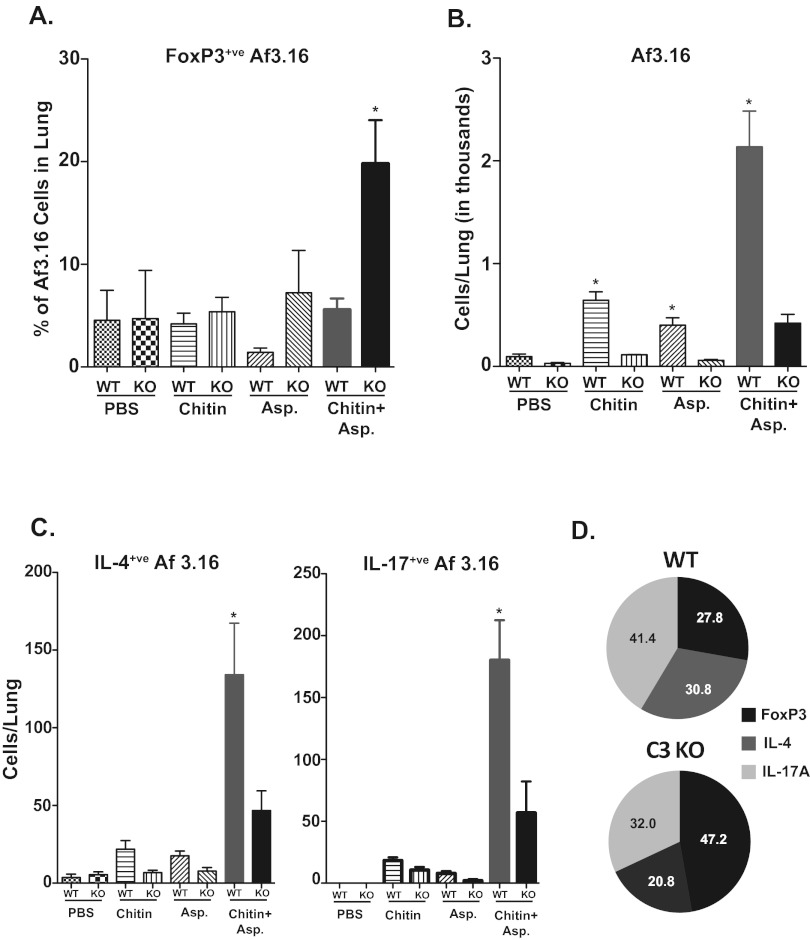
FIG 7 .
Chitin-induced differentiation of Af3.16 CD4 T cells is regulated by C3. A total of 1 × 10⁶ magnetic bead-enriched Af3.16 CD4 T cells were adoptively transferred into WT and C3KO mice by the intravenous route. One day later, chitin and Aspergillus antigens were administered, and this was repeated on days 3 and 6. On day 7, lungs were perfused with ~5 ml of PBS and cells were harvested and stimulated with anti-CD3 and anti-CD28 antibodies in the presence of Golgi Stop for 5 h. After incubation, cells were surface stained before staining for intracellular cytokine and FoxP3 using specific antibodies. Cells were analyzed by flow cytometry. (A) Percentage of FoxP3+ cells among Thy1.1+ Af3.16 cells; (B) total numbers of Af3.16 cells in the lung; (C) total numbers of IL-4+ and IL-17+ Af3.16 cells in the lung; (D) pie chart showing relative distribution of FoxP3+, IL-4+, and IL-17+ cells among Af3.16 cells in WT and C3KO mice that received chitin and Asp. In panel A, the mean total numbers of lung cells for the respective groups were as follows: PBS, WT, 0.67 × 10⁶ versus KO, 0.74 × 10⁶; chitin, WT, 0.99 × 10⁶ versus KO, 0.69 × 10⁶; Asp, WT, 0.89 × 10⁶ versus KO, 0.95 × 10⁶; and chitin and Asp, WT, 2.92 × 10⁶ versus KO, 2.67 × 10⁶. Values are means ± SEM from 5 mice/group.

