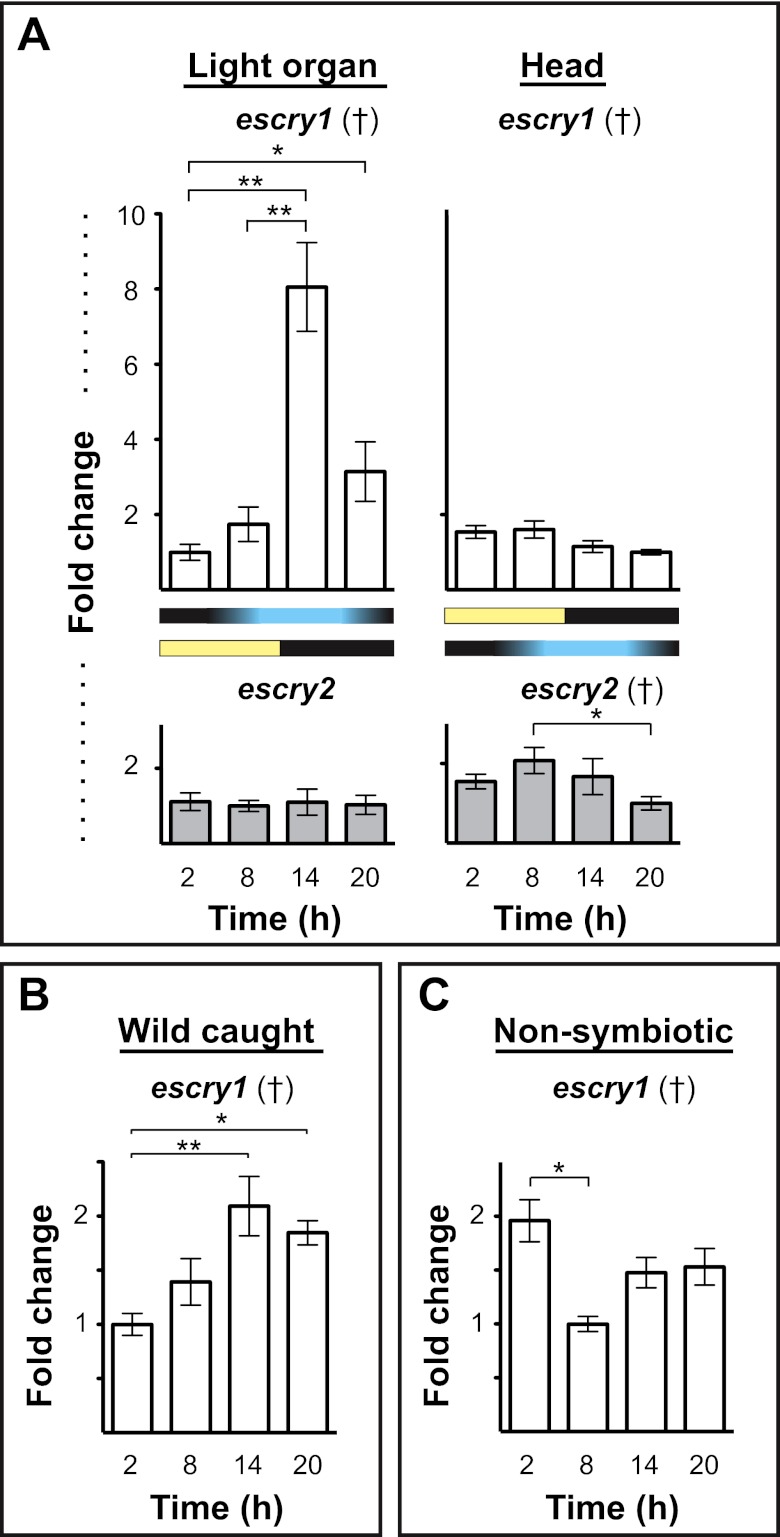
FIG 2 .
Day/night cycle variation in E. scolopes cryptochrome expression. (A) The expression of escry1 and escry2 in the squid light organ and head over four points in the day/night cycle. Graphs indicate the relative expression of escry1 and escry2 as measured by qRT-PCR. Yellow and black bars denote the cycle of exogenous light, and the blue and black bars show the cycle of bacterial light production in the light organ. (B) Expression of escry1 in the light organs of mature squid caught in the wild and maintained in natural light. (C) escry1 expression over the day/night cycle in nonsymbiotic light organs. All data were normalized to the time point of lowest expression in each graph. Error bars represent the standard errors of the means. n = 2 to 6 biological replicates and 2 technical replicates per condition. †, ANOVA P value < 0.05. *, pairwise comparison, P < 0.05; **, pairwise comparison, P < 0.01.

