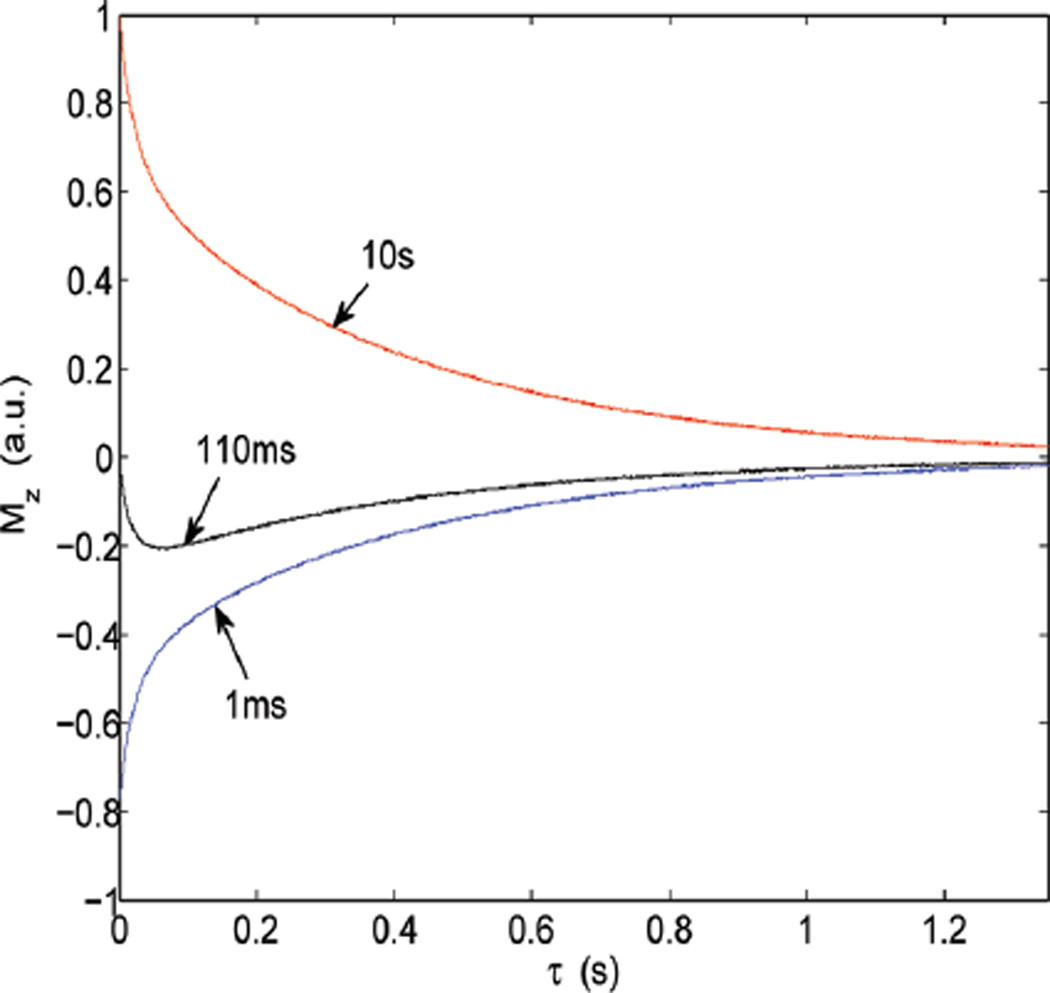
Figure 3.
Sample raw data resulting from the 2H 2DT1–T2 correlation experiment using the pulse sequence shown in Figure 1, on sample I. The figure shows selected slices from the 2D map for t1 = 1 ms, 110 ms, and 1s. By performing a 2D ILT of the experimental data, one obtains a correlation map that correlates T1 to T2 shown in Figure 4.

