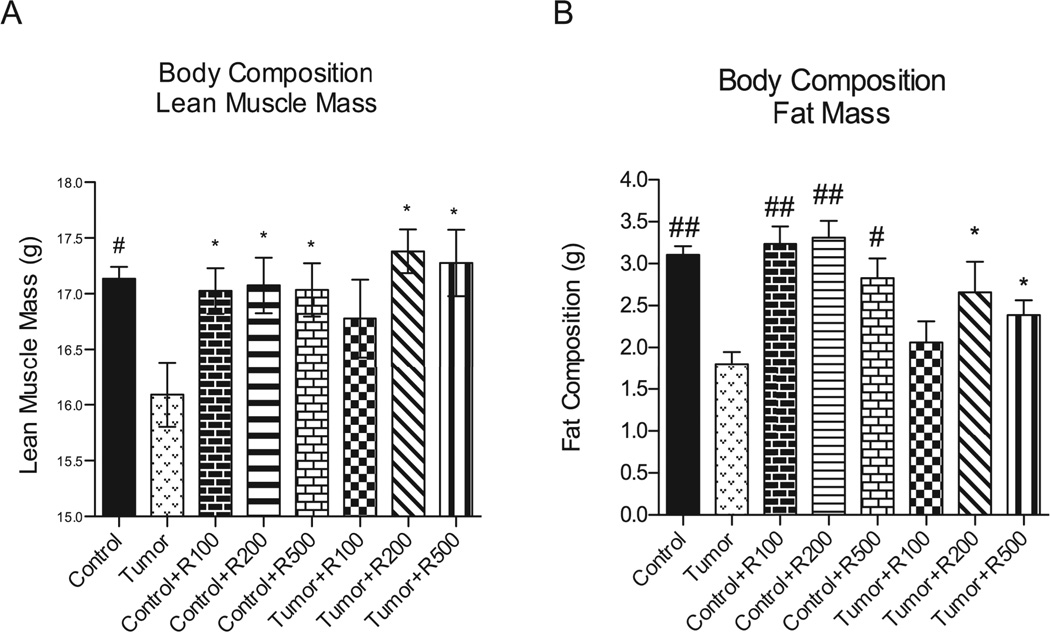
Figure 2. Final body composition among non-tumor bearing and tumor bearing mice.
Whole mouse body composition was determined and graphed to show final mass in grams among all groups. (A) Significant lean muscle mass loss was seen in the untreated tumor bearing mice compared to control mice, control mice receiving resveratrol at all dosages and tumor bearing mice receiving resveratrol at the 200 mg/kg and 500 mg/kg levels. (B) Fat mass compositions were compared among the same subsets with significant fat mass loss shown in the untreated tumor bearing group. The tumor bearing groups receiving resveratrol showed significant responses by maintaining more fat mass in the 200 mg/kg and 500 mg/kg groups. The untreated and treated control groups also were significantly higher in fat mass composition compared to untreated tumor bearing. ## = p <0.0001, # = p <0.001, ** = p < 0.01, * = p < 0.05. For (A) and (B) N=24 (Tumor), N=8 (Tumor +R100), N=8 (Tumor +R200), N=8 (Tumor +R500). For (C) N=17 (Tumor), N=6 (Tumor +R100), N=6 (Tumor +R200), N=7 (Tumor +R500).

