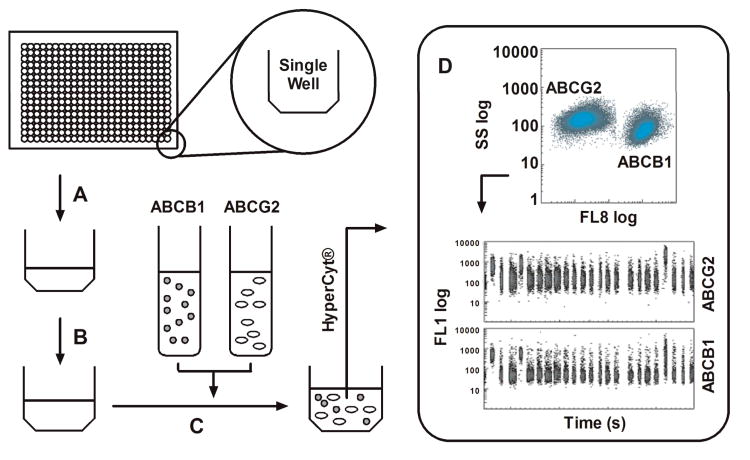
Figure 3.
General scheme for the duplex HTS flow cytometric screening campaign. (A) In 384 well format, 1 μM JC-1 in PBS is added to the assay wells. (B) A volume of 100 nL of test compound is added to each well via pintool transfer (final concentration of 6.6 μM). (C) A 3 × 10⁶ cells mL−1 mixture of both cell lines is added to each well. The ABCB1 cell line was previously color-coded with CellTrace™ Far Red DDAO-SE prior to mixture with the unlabeled ABCG2 line. (D) Flow cytometric data of light scatter and fluorescence emission at 530 +/− 20 nm (488 nm excitation, FL1) and 665 +/− 10 nm (633 nm excitation, FL8) are then collected via HyperCyt®. Each population is gated in FL8 allowing for analysis of FL1 in individual time bins for each cell line. The JC-1 retention can then be quantified as an indication of efflux inhibition by test compound(s). The FL1 versus time excerpt shown represents 24 binned wells of a 384 well plate.

