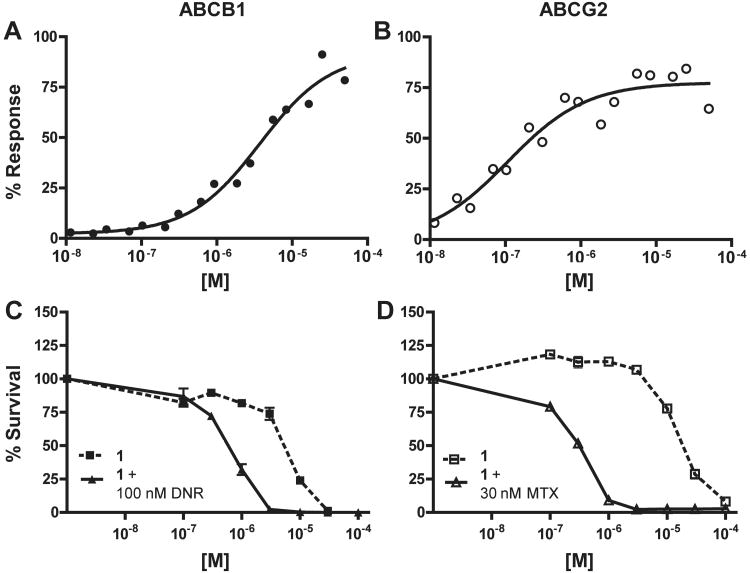
Figure 5.
Efflux inhibition and chemotherapeutic potentiation of 1 (CID 44640177). (A) A representative curve showing efflux inhibition of ABCB1 in Jurkat-DNR cells (closed circles). The average IC50 (n = 3) is 4.65 ± 0.74 μM. (B) A representative curve showing efflux inhibition of ABCG2 in Ig-MXP3 cells (open circles). The average IC50 (n = 2) is 0.13 ± 0.03 μM (C) Potentiation of daunorubicin (DNR) mediated killing in Jurkat-DNR cells with 1 (n = 2 per data point). The CR50 (closed triangles) is 0.55 μM while the TD50 (closed squares) is 5.52 μM. Minimum allowable toxicity is set at 15 μM, thus the toxicity here is below the cut-off. (D) Potentiation of mitoxantrone (MTX) mediated killing in Ig-MXP3 cells (n = 2 per data point). The CR50 (open triangles) is 0.31 μM while the TD50 (open squares) is 18.30 μM. The minimum toxicity and the CR50/TD50 ratio (equal to 59) meet the cut-off criteria for a desirable compound in the chemoreversal secondary ABCG2 assay.

