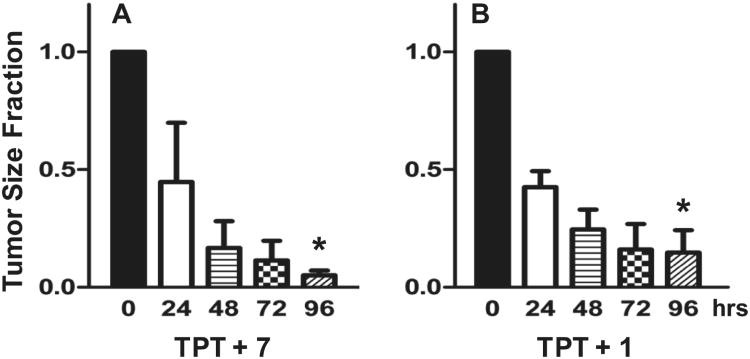
Figure 6.
Response of ABCG2 resistant Igrov1/T8 derived tumors in mice to combination therapy of 150 nM topotecan (TPT). The tumor size at 0, 24, 48, 72, and 96 hr is indicated (n = 3) along with the standard error of the mean (SEM). The significant difference between the mean values from 0 to 96 hr is indicated by an asterisk (p < 0.001). Inhibitor concentration was selected based on potentiation efficacy balanced with apparent cellular toxicity. Significant tumor reduction was noted in both cases. (A) Compound 7 (original MLSMR hit) at 500 nM in conjunction with TPT. (B) Probe compound 1 at 100 nM with TPT.

