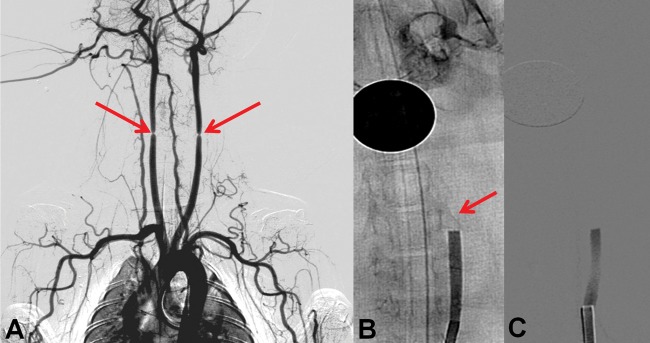
Figure 1.

Rabbit thromboembolic occlusion model. (A) Angiogram depicting the bilateral stenosis of the common carotid artery prior to clot injection (arrows). (B) Digital subtraction angiography (DSA) post clot injection (arrow) reveals an occlusion. After allowing 45 min for vessel–clot interaction, the external sutures were released. (C) Post suture removal DSA reveals a stable occlusion and no distal clot migration.
