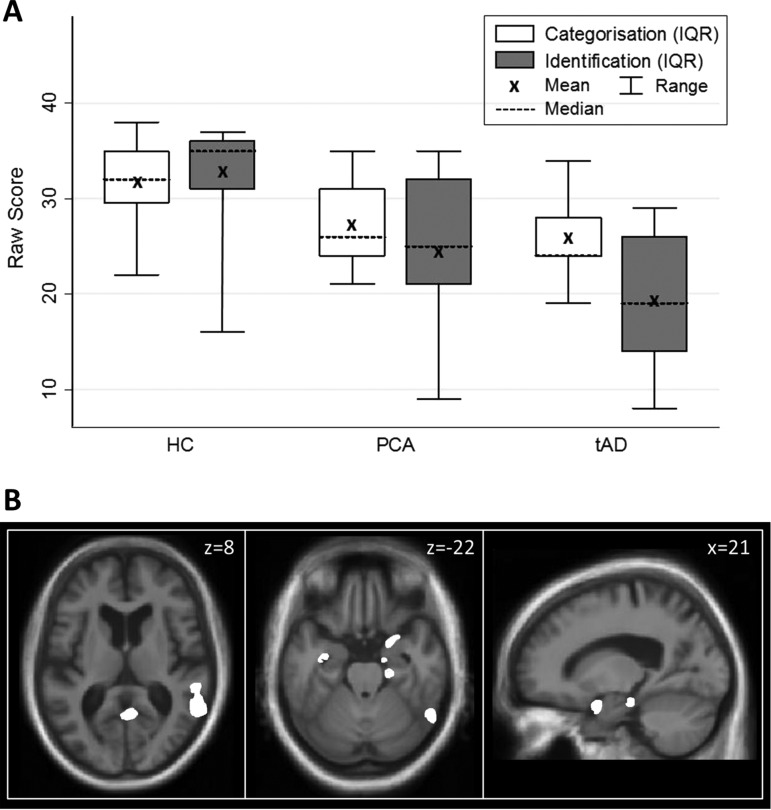
Figure 1.
Summary of behavioural and neuroanatomical findings. (A) Distribution plots of olfactory performance comparing mean, median, IQR and full range of odour categorisation and identification of raw scores of subjects in the healthy control (HC), posterior cortical atrophy (PCA) and typical Alzheimer's disease (tAD) groups. (B) Statistical parametric maps (SPMs) of regional grey matter atrophy associated with odour identification performance across the combined PCA and tAD cohorts. SPMs are shown rendered on axial (left, middle panels) and sagittal (right panel) sections of the mean normalised structural T1-weighted brain MR image. The axial sections show the right hemisphere on the right; the sagittal section is through the right hemisphere. For display purposes, SPMs have been thresholded at p<0.001 uncorrected over the whole brain volume; see online supplementary table S3 for associations attaining significance after multiple-comparisons correction. The plane of each section is shown in Montreal Neurological Institute (MNI) coordinates in millimetres (mm).

