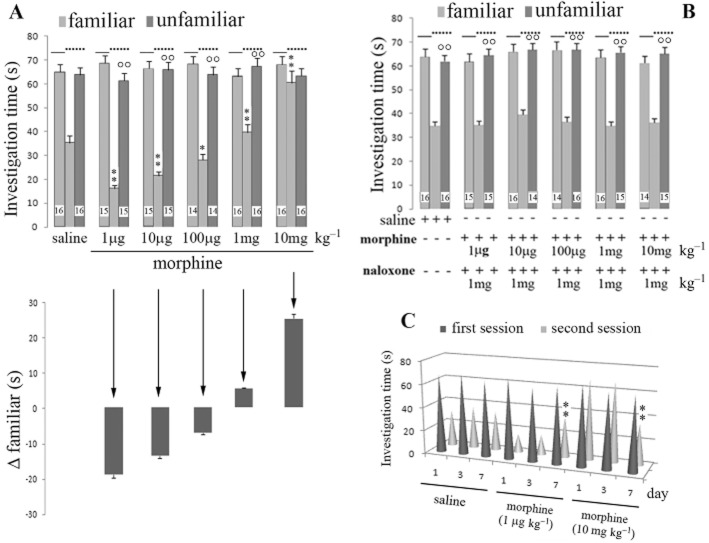
Figure 1.
Dose–effect curve of morphine in the social learning test. (A) Investigation times of juveniles by adult rats is shown during the first exposure and on re-exposure after 24 h. Dat are shown for familiar and unfamiliar rats after morphine administration at different doses (1 μg–10 mg kg−1) 5 min before the first exposure to the social learning test. (B) The same experiment was repeated in the presence of naloxone (1 mg kg−1). C: Effect of different intervals (1, 3 or 7 days) between exposures on the investigation time versus familiar rat for systemic saline and morphine administration. Vertical bars represent SEM; **α < 0.01 or *α < 0.05, significantly different from saline treatment (A, B) or day interval investigation (C); °°α < 0.01, familiar versus unfamiliar juvenile (A, B). The numbers shown in the Figure represent the number of animals used in each experiment (A, B). At least 10 animals were used in panel C.

