
Figure 1.
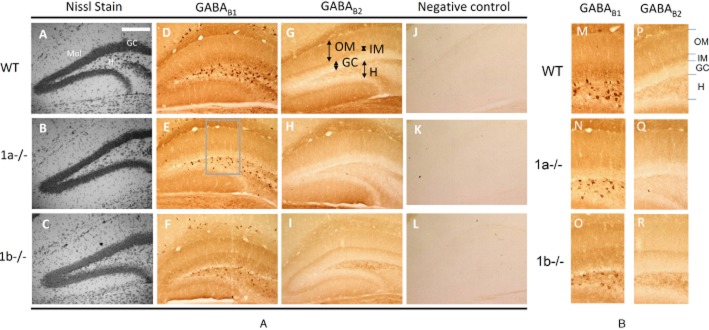
Distribution of GABAB receptor subunits in the DG of 1a–/– and 1b–/– mice. (A–C) The Nissl stain in the DG shows no significant anatomical differences for cell populations in the GC layer, molecular layer (Mol) and the hilus (H) between the wild-type (WT), 1a–/– and 1b–/– mice. (D–F) GABAB1 immunolabelling in the DG using an immunoperoxidase method reveals high intensity staining in the cell bodies and proximal dendrites of hilar neurons, and in the neuropil of the inner molecular layer (IM, see panel G). The number of immunopositive hilar neurons is lowered in the 1a–/– (E) and 1b–/– mice (F). The neuropil staining is reduced in the IM in the 1a–/– mice and the outer molecular layer (OM, see panel G) in the 1b–/– mice. (G–I) GABAB2 immunoperoxidase labelling in the DG show that the relative neuropil staining intensities in the IM and the OM were reduced in the 1a–/– (H) and the 1b–/– mice (I) respectively. (J–L) Examples of negative control sections processed without the addition of GABAB1 or GABAB2 antibodies show low levels of background staining. The scale bar for all sections (200 μm) is shown in panel A. (M–R) Enlarged sections from panels D–I (see the frame in panel E) showing the immunostaining patterns in the molecular layer and hilar neurons.