Figure 2.
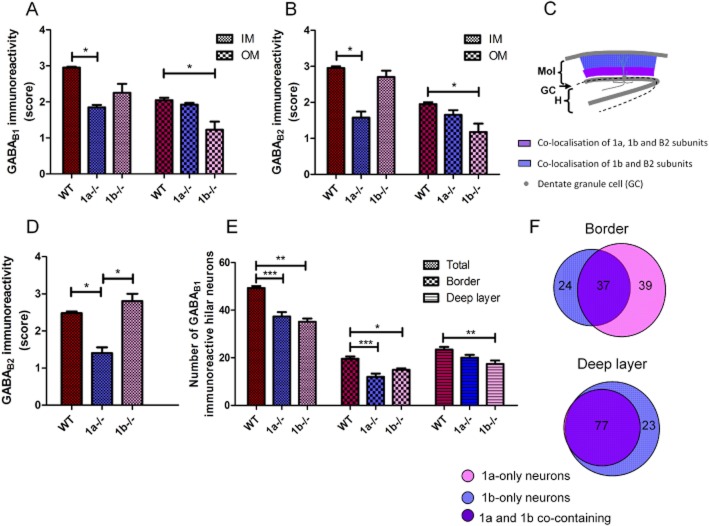
Comparison of GABAB receptor subtype expression in the molecular layer (A–C) and hilar neurons (D–F). (A) The relative intensity scores of B1 immunostaining were significantly reduced in the IM in the 1a–/– mice (*) and in the OM only in the 1b–/– mice (*) compared with the WT. (B) The relative intensity scores of B2 immunostaining were significantly reduced in the IM in the 1a–/– (*) and the OM in the 1b–/– mice (*). The scores range from 0 (no staining) to 3 (the highest intensity) and were used for all sections the brain processed simultaneously. Each score was the mean from 8–20 sections. Nonparametric Kruskal–Wallis test and Dunn's post tests were performed. (C) A schematic of the relative co-localization of 1a, 1b and B2 subunits in the molecular layer. (D) The relative intensity scores of B2 immunostaining were significantly reduced in the hilus in the 1a–/– mice (*P < 0.05, nonparametric Kruskal–Wallis test and Dunn's post tests). (E) The total number of immunopositive hilar neurons (Total) was significantly decreased in the 1a–/– (***) and 1b–/– mice (***). The number of neurons at the hilus–GC border zone (Border) also significantly decreased in the 1a–/– (***) and 1b–/– mice (*). However, the number of hilar neurons in deep layers was only significantly lower in the 1b–/– mice (*). The data were mean counts from 8–20 sections per brain. Two-way anova and Bonferroni's multiple comparison tests were used (*P < 0.05, **P < 0.01, ***P < 0.001). N = 4 brains of each genotype. (F) Venn diagrams illustrate the relative percentages of hilar neurons containing 1a, 1b or both in the border zone and the deep layer respectively.

