Fig 5.
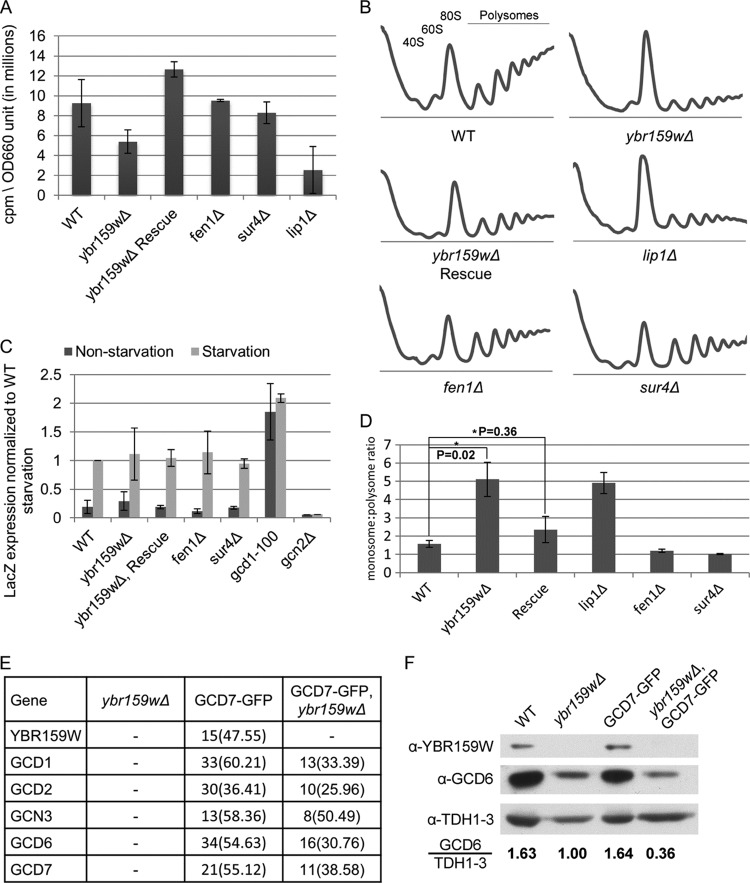
Translation assays on the ybr159wΔ strain. (A) Translation efficiency as measured by [35S]methionine incorporation. Values are counts per minute per OD660 unit of cells. The results shown are from at least three replicates. (B) Polysome profiling of the ybr159wΔ and other VLCFA null strains. At least three replicates were performed for each strain. Although the example ybr159wΔ plot does not show a 40S ribosome peak, all other replicates of the strain showed a 40S peak similar to the WT. (C) Assay for GCN4 pathway competence by GCN4-LacZ induction. The results are expressed as the LacZ expression per mg of protein per min normalized to the WT starvation condition. Starvation conditions were induced by 10 mM 3-AT in synthetic complete minus histidine media for 4 h. The gcd1-100 strain has a constitutively derepressed GCN4 pathway and constant GCN4 protein translation, while the gcn2Δ strain is incapable of derepression of GCN4 and cannot produce significant amounts of GCN4 protein. (D) Ratio of monosome to polysome peak areas for the polysome profiles. P values were generated using the Student t test from at least three individual replicates. (E) GFP pulldown of eIF2B complexes in a ybr159wΔ background. After pulldown LC-MS/MS was performed to identify the proteins. An untagged ybr159wΔ strain and GCD7-GFP tagged strain were used as controls. Displayed are unique peptide hits and the percentage of coverage as described in Fig. 2A. (F) Western blot analysis of WT, ybr159wΔ, and GFP-GCD7 strains. The yeast strains in panel D and the WT strain AL400 were used. Equivalent amounts of whole-cell extracts were loaded on the SDS-PAGE gel. The Western signals for GCD6 and TDH1 to -3 were determined by densitometry. The ratio of the anti-GCD6 to the anti-TDH1-3 signal is shown for each strain. The anti-TDH1-3 antibody does not distinguish between the three GAPDH (glyceraldehyde-3-phosphate dehydrogenase) gene duplications in yeast.

