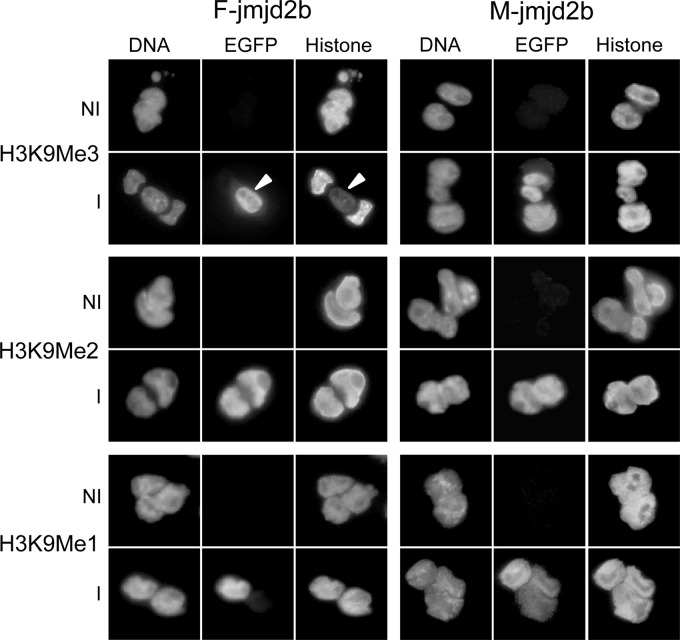
Fig 4.
Immunofluorescence analysis of histone modifications in induced (I) and noninduced (NI) F- and M-jmjd2b ES cells. Cells were costained for DNA and with antibodies specific for EGFP and the indicated histone modification. The arrowheads indicate an induced cell next to two noninduced cells, highlighting the specific reduction of H3K9me3 in induced cells.

