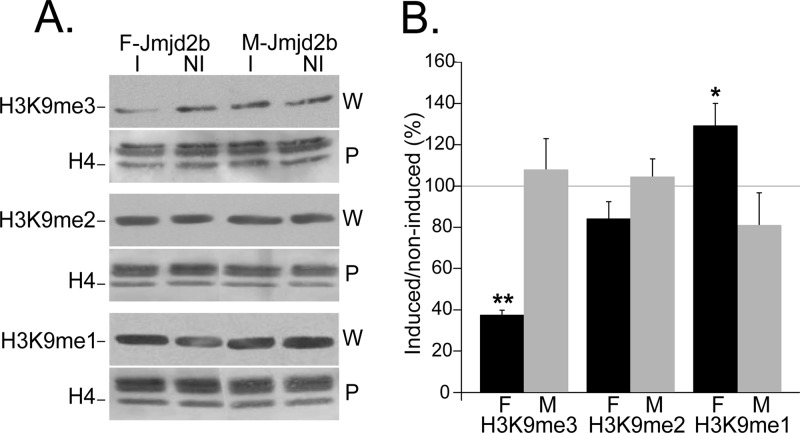
Fig 5.
JMJD2B-dependent changes in levels of H3K9 methylation states. Histone extracts from induced (I) and noninduced (NI) F- and M-jmjd2b cells were quantified for the indicated histone modifications by Western analysis. (A) Representative immunoblots for the indicated H3K9 methylation mark. For each modification, the top panel (W) is the immunoblot and the bottom panel (P) is the respective Ponceau S-stained blot. The H4 band that was used for normalization is indicated in the Ponceau S-stained blot. (B) Results represent H3K9 methylation levels in induced cells as a percentage of the levels in noninduced cells. F, F-jmjd2b cells; M, M-jmjd2b cells; error bars, SEMs determined from 3 repeats; asterisks, significant changes (**, P < 0.01; *, P = 0.074, determined by two-tailed paired t test on log expressions).

