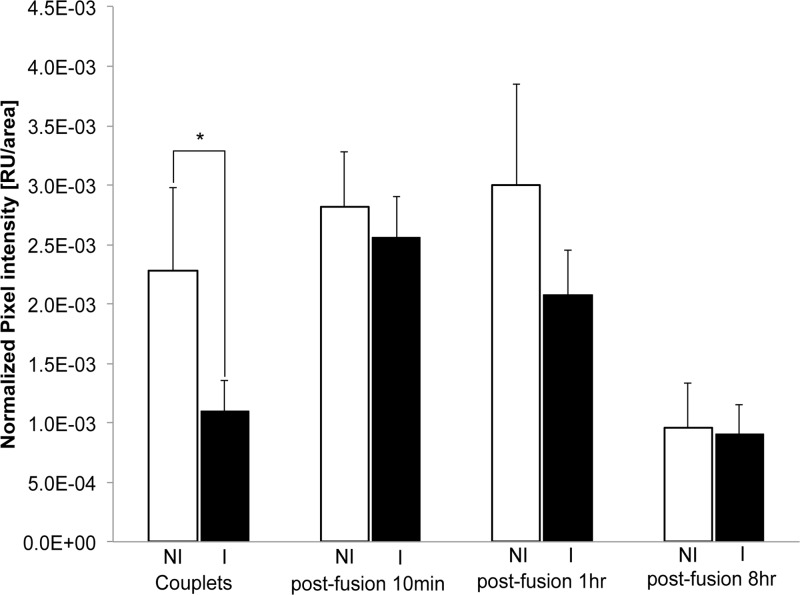
Fig 8.
Quantification of H3K9me3 in NT reconstructs generated from induced and noninduced F-jmjd2b ES cells. Shown is the normalized pixel intensity for noninduced (NI) and induced (I) F-jmjd2b ES donor cells attached to enucleated oocytes (or cytoplast marked C in Fig. 7) prior to fusion (couplets; noninduced, n = 12; induced, n = 11) and NT reconstructs 10 min (noninduced, n = 14; induced, n = 13), 1 h (noninduced, n = 8; induced, n = 9), and 8 h (noninduced, n = 8; induced, n = 9) after fusion of the donor nuclei (marked D in Fig. 7) and cytoplast. Note that due to differences in the exposure times for different developmental reconstruct stages, only values of induced versus noninduced of the same reconstruct stage are directly comparable. Error bars depict SEMs. RU, relative units; *, significant (P < 0.05) difference determined by two-tailed paired t test.

