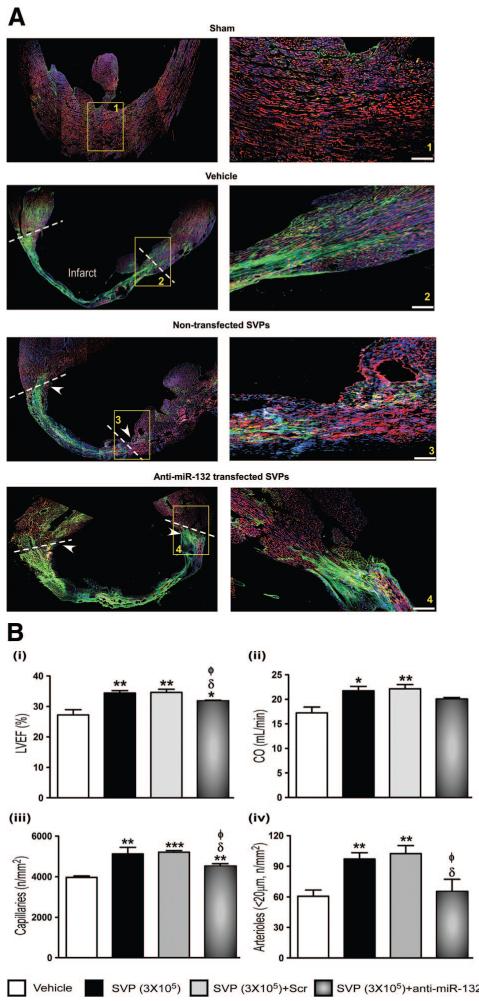
Figure 5. A, Immunofluorescence confocal microscopy images showing the levels of miR-132 target gene p120RasGAP in myocardium.
Arrowheads indicate the site of SVP injection, dotted lines delimitate the infarct area and magnification panel of boxed area is shown in right panel. B, Bar graphs showing hemodynamic data (i and ii) and vascular profile (iii and iv) at 14 days post-MI. Data are means±SE (n=5 mice per group except for hemodynamic measurements which consisted of 6 mice). *P<0.05, **P<0.01, and ***P<0.001 vs vehicle; δP<0.05 vs nontransfected SVPs; ɸP<0.05 vs Scrtransfected SVPs.

