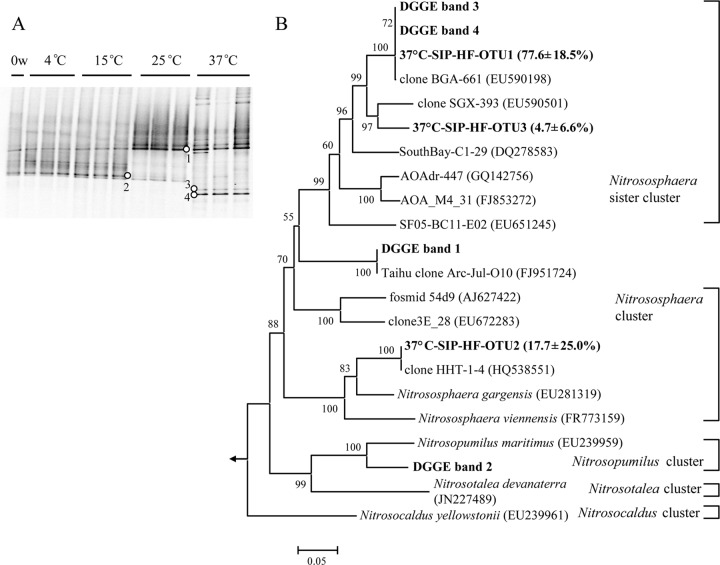
Fig 4.
Composition of AOA in sediment microcosms before (0 weeks [w]) and after incubation for 8 weeks, as revealed by fingerprinting of amoA genes. (A) DGGE of archaeal amoA genes from triplicate sediment microcosms before (0 w) and after incubation for 8 weeks at different temperatures. Numbered dots refer to bands described in the text. (B) Phylogenetic tree of amoA genes from dominant DGGE bands and from heavy fractions of 37°C SIP gradients; clone libraries were made from heavy fractions of each replicate 13C-labeled microcosm, and values in parentheses are the average percentages of the indicated OTU in the three libraries. The classification of AOA clusters followed that presented in reference 46.

