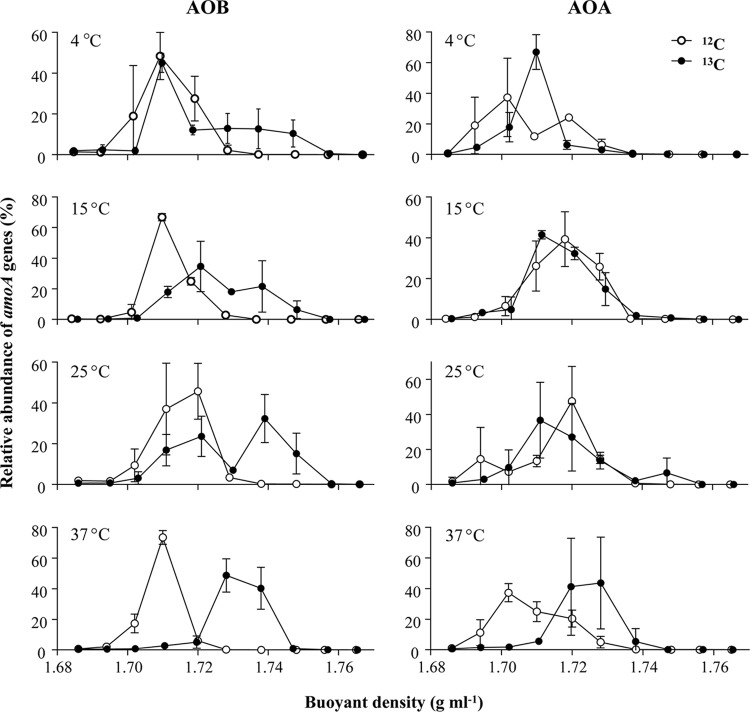
Fig 5.
Relative abundances of amoA genes recovered from CsCl gradient fractions after incubation for 8 weeks for AOB and AOA. Quantities were determined by qPCR. The y axes indicate the relative abundance at each gradient fraction, with the total quantity detected from a gradient set equal to 1.0. Results represent means ± standard deviations of two replicate microcosms, except for the 13C-labeled 37°C microcosms, for which three replicates were analyzed.

