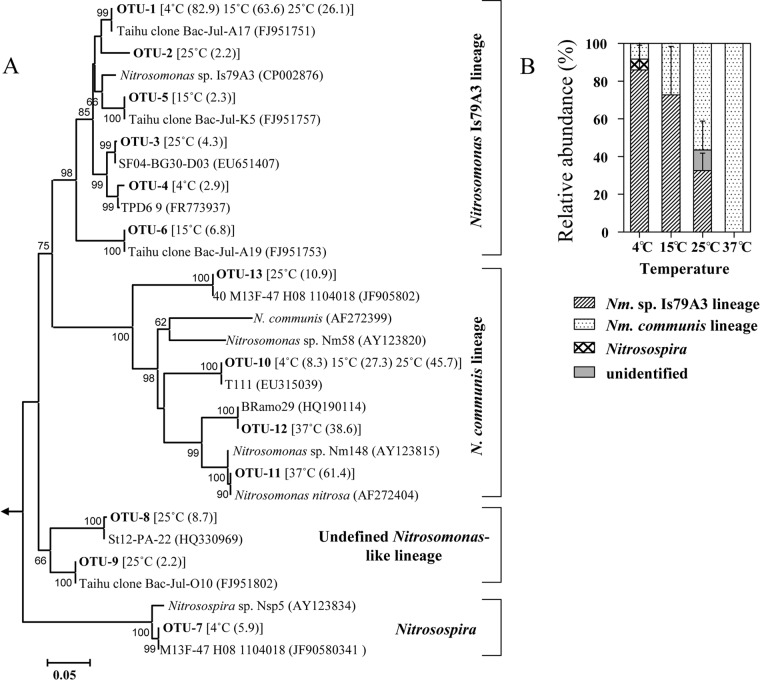
Fig 6.
Compositions of active AOB communities in sediment microcosms. (A) Neighbor-joining phylogenetic tree of bacterial amoA genes retrieved from the heavy fractions of CsCl gradients. Representative sequences for each OTU, as defined by 97% identity, are shown in bold. Key reference sequences and closest-match sequences were included in the tree. Only bootstrap values greater than 50% are shown. Values in parentheses after the indicated OTU are the average percentage (two replicates) at different temperatures. (B) Relative abundance of AOB lineages in heavy fractions at different temperatures. Error bars represent standard deviations from duplicate microcosms.

