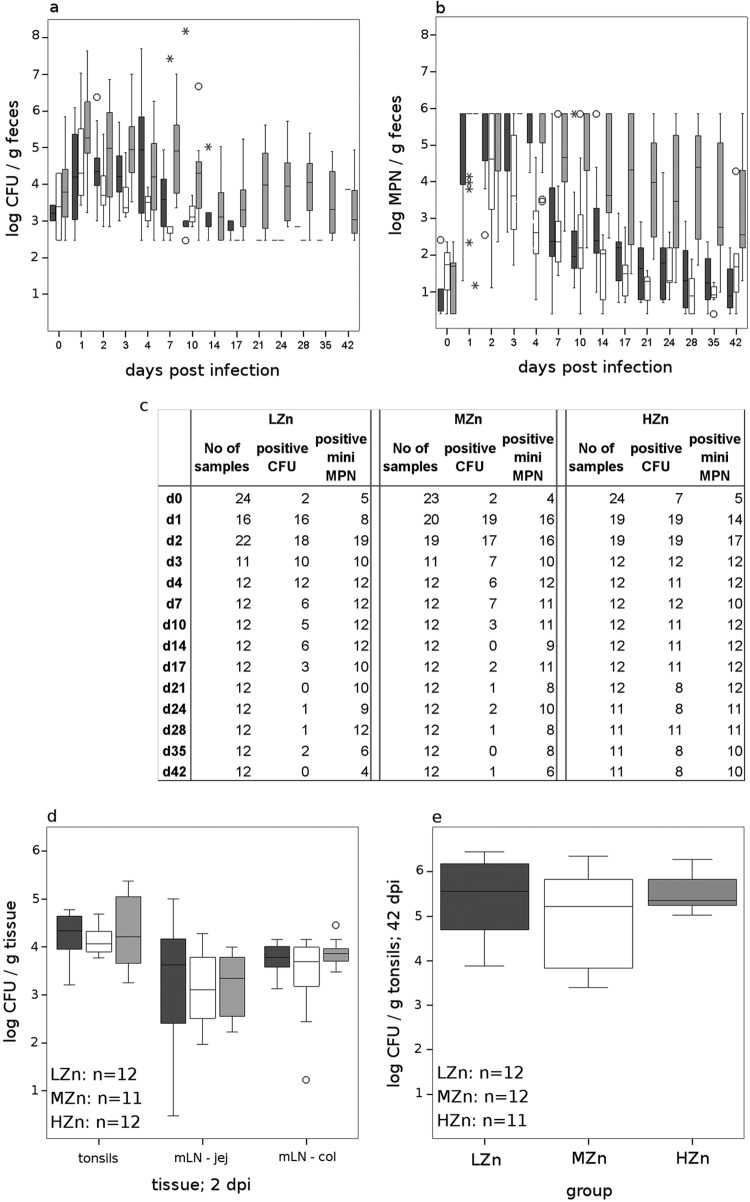
Fig 1.
Box plots of log-transformed CFU (a) and mini-MPNs (b) of Salmonella Typhimurium in fecal samples and in organs (d and e) after oral infection of pigs fed a diet with 60 to 80 mg Zn/kg (LZn), 150 mg Zn/kg (MZn), or 2,500 mg Zn/kg (HZn) as ZnO. The upper limit of the mini-MPN method was 6 log. Boxes indicate the medians (horizontal lines) and the lower and upper quartiles (bottoms and tops of boxes). The vertical bars in the box plots indicate the minimal and maximal values recorded. Circles and asterisks indicate outliers. Dark gray boxes, LZn; white boxes, MZn; light gray boxes, HZn. jej, jejunum; col, colon. (c) Numbers of fecal samples analyzed and numbers of samples positive by XLD-NAL plating and by the mini-MPN method. d, day postinfection. (d and e) The number of organ samples analyzed for each group is given at the bottom left of each box plot. Salmonellae could not be reliably counted in the mesenteric lymph nodes (mLN) at 42 dpi; thus, only values for tonsils are shown at this time point.

