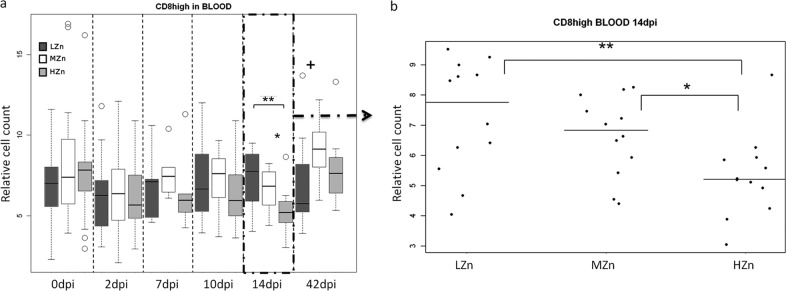
Fig 4.

CD8+ cytotoxic T cell counts, relative to those of the living lymphocyte population, in the blood of piglets receiving different Zn concentrations in their diets before and after challenge with S. Typhimurium (a) and 14 dpi (b). (a) Dark gray bars, low Zn concentrations (LZn) in the diet (about 50 to 80 mg/kg of feed); white bars, medium Zn levels (MZn) in the diet (150 mg Zn/kg); light gray bars, high Zn levels (HZn) in the diet (2,500 mg Zn/kg). The numbers of samples analyzed were as follows: before infection (0 dpi) and at 2 dpi, 24 in the LZn group, 23 in the MZn group, and 24 in the HZn group; at 7, 10, and 14 dpi, 12 in each group; and at 42 dpi, 12 in the LZn and MZn groups and 11 in the HZn group. (b) Relative CD8+ cytotoxic T cell counts in LZn, MZn, and HZn piglets at 14 dpi (n = 12). All piglets were weaned at the age of 28 days and were orally infected with S. Typhimurium on day 32. The plus sign indicates a tendency, and asterisks indicate significance (+, 0.05 < P < 0.1; *, 0.01 < P < 0.05; **, P < 0.01). The vertical bars in the box plots indicate the minimal and maximal values recorded. Circles represent outliers.
