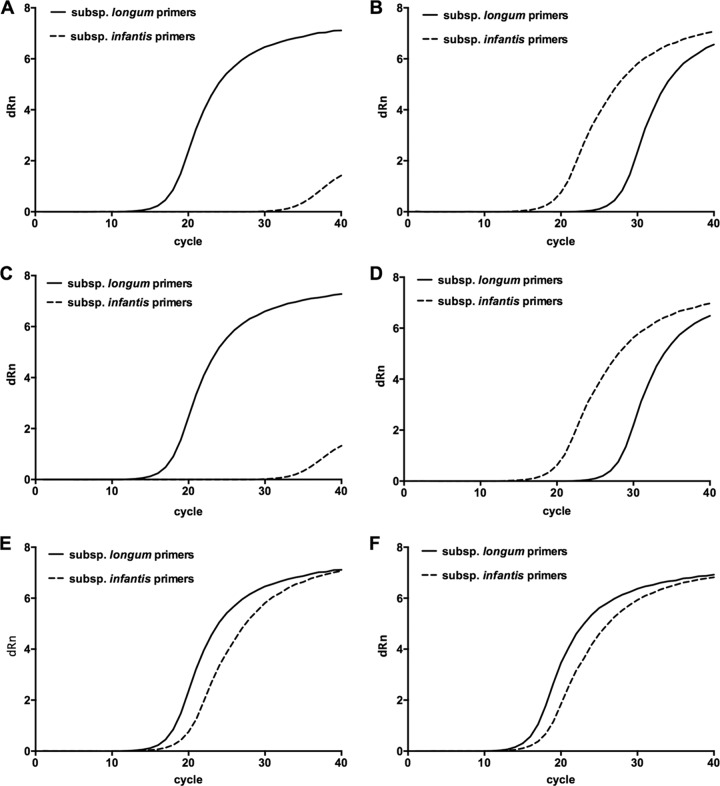
Fig 3.
Differentiation between B. longum subsp. longum and B. longum subsp. infantis using qPCR. Amplification curves (for clarity of reproduction, data generated by ABI software were used to prepare Prism graphs) for target 16S rRNA sequences. (A) DNA template from B. longum subsp. longum ATCC 15707T; (B) DNA template from B. longum subsp. infantis DSM 20088T; (C and D) templates from B. longum subsp. longum and infantis tested in the presence of stool DNA from an infant without bifidobacteria; (E) mixed templates (1:1 ratio); (F) the mixed templates in the presence of stool DNA. Note that the results in panels A and C, B and D, and E and F are highly similar, indicating that the presence of fecal DNA does not alter the amplification kinetics.

