
Fig 4.
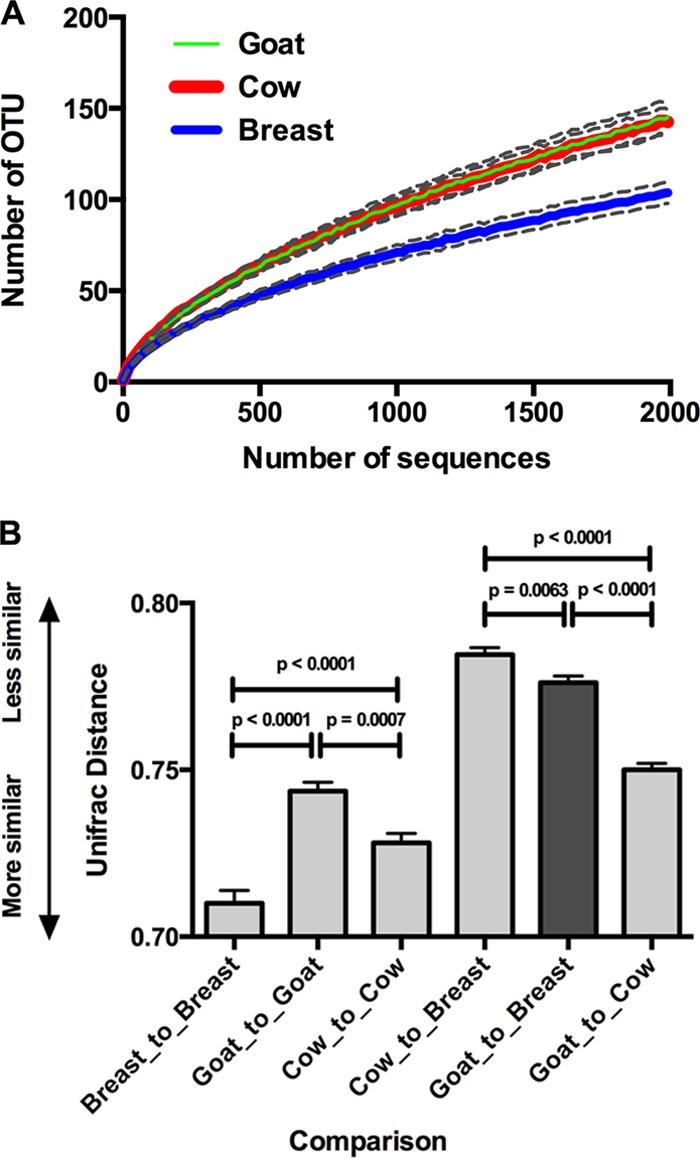
Similarity comparisons. (A) Alpha-diversity as measured by OTU accumulation with respect to sequence accumulation for the three dietary groups. Dashed lines indicate 95% confidence intervals. (B) Beta-diversity measures shown as unweighted UniFrac distances. Dietary groups were compared with themselves and with other diets. Mean values with SEM are shown. Significance values (P, Kruskal-Wallis) are also shown. Data from 30 infants per group were compared.