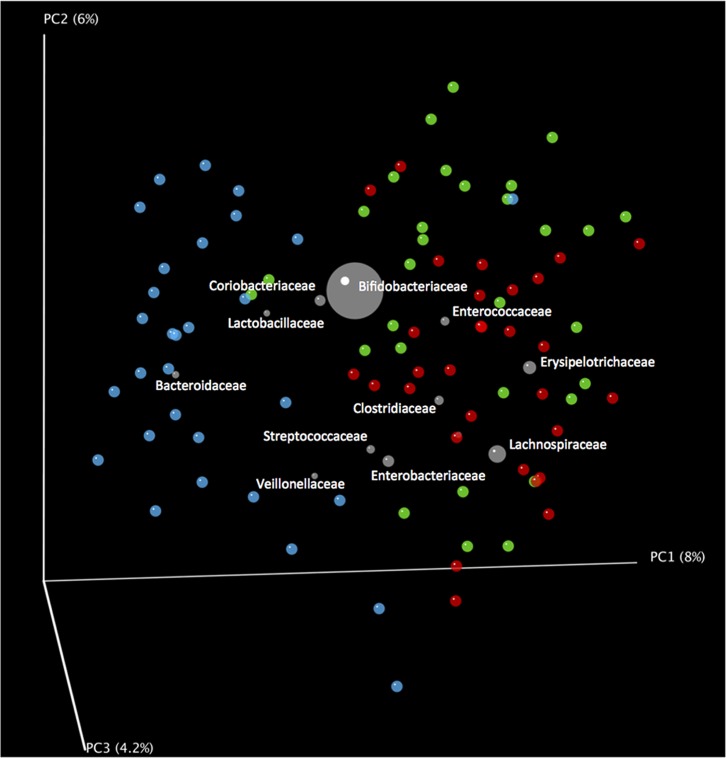
Fig 5.
Biplot representation of principle coordinates of unweighted, pairwise UniFrac distances showing clustering of bacterial groups with stool samples. Stools from breast milk-fed infants, blue spheres; goat milk formula-fed infants, green spheres; cow milk formula-fed infants, red spheres. Taxon positions (gray spheres) are weighted (relative abundance) averages of the coordinates of all samples. Note association of Bacteroidaceae with breast milk-fed infant stool. Data from 30 infants per group were analyzed.

