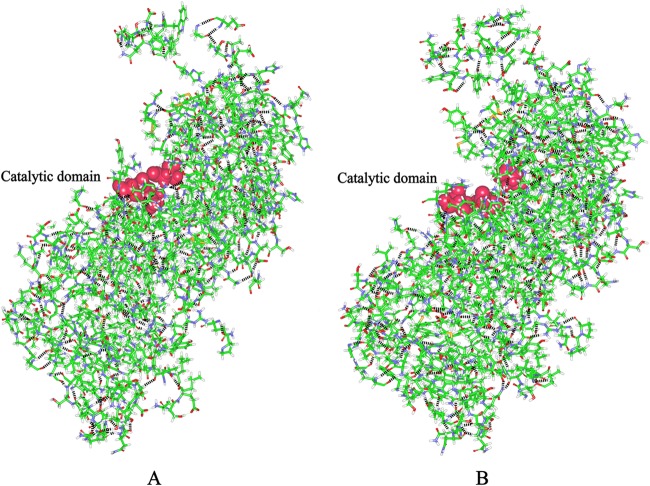
Fig 7.
Local hydrogen bonding network of the enzyme. The active site is shown in magenta according to the CPK representation scheme. The sticks indicate the residues that could produce hydrogen bonds. The hydrogen bonds are shown with black dotted lines. (A) The local hydrogen bonding network of AmyK. (B) The local hydrogen bonding network of AmyK-p1.

