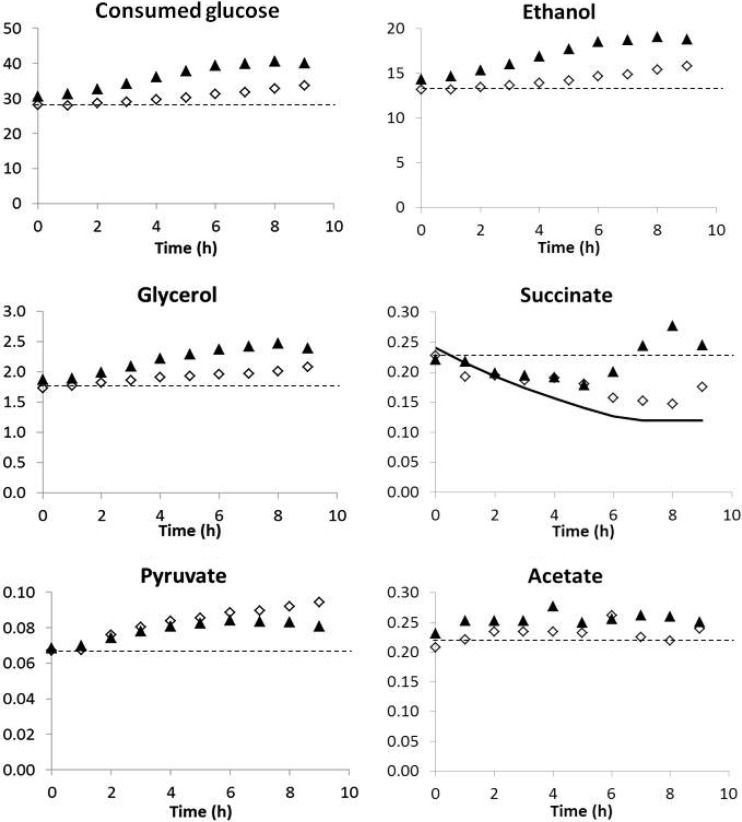
Fig 2.
Effect of nitrogen addition during the stationary phase of FSCF on metabolite concentrations. ▲, ammonium pulse in the third stage of FSCF; ♢, valine pulse in the third stage of FSCF; dashed line, concentration in the tank without nitrogen addition; the solid line (succinate) reports the evolution of metabolite concentration due only to washout of the tank (production rate = 0). Glucose, ethanol, glycerol, succinate, pyruvate, and acetate concentrations are expressed in g/liter. One representative experiment of three biological replicates is shown.

