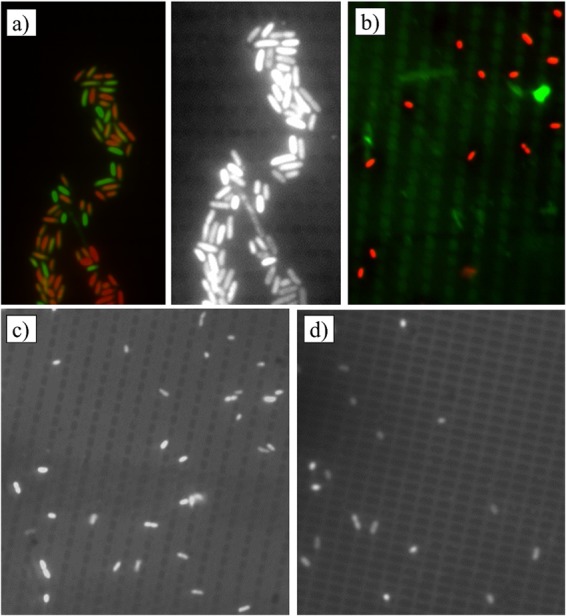
Fig 2.

Fluorescence microscopic images of attached cells after 30 min, showing preferential positioning relative to surface topography. (a) E. coli ATCC 25922 on silica with thin wells (photos are two versions of the same field; the black and white image accentuates the topographical details). (b) L. innocua on silica with thin wells. (c to d) P. fluorescens on thin-well silica and wide-well silica, respectively. In the color images, dead cells are shown in red, live cells are shown in green.
