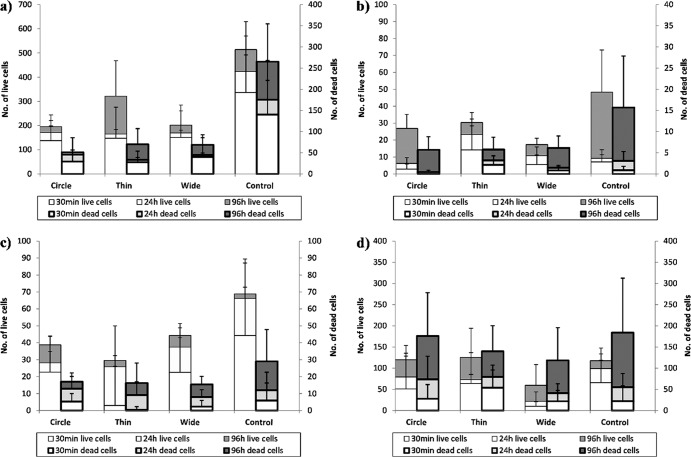
Fig 5.
Average numbers of live (thin borders, left axis) and dead (thick borders, right axis) cells attached after 30 min, 24 h, and 96 h on silica surfaces. (a) E. coli ATCC 25922; (b) E. coli O157:H7 4477; (c) P. fluorescens 1150; (d) L. innocua FSL C2-008. The units on the y axis represent number of cells per microscopic field (see description in Materials and Methods). Error bars show standard deviations.

