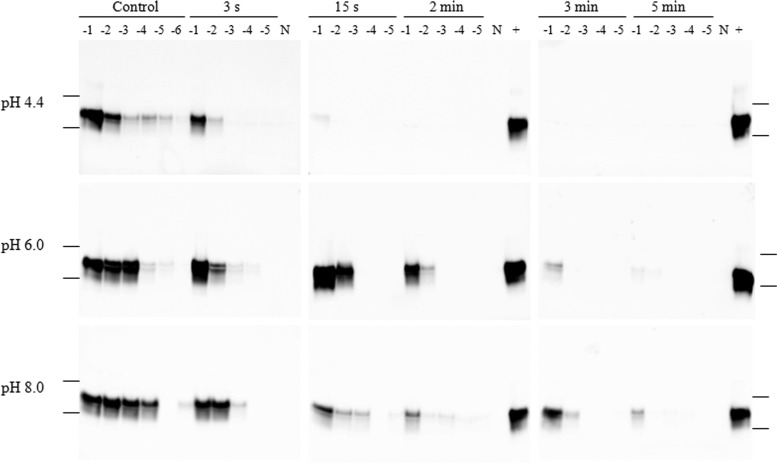
Fig 2.
Western blot images of 0.01% IBH samples ozonated at 20°C and amplified by PMCA. The images in each row, from left to right, represent positive-control samples and samples treated with ozone for 3 s, 15 s, 2 min, 3 min, and 5 min. The numbers above the blots (−1 to −6) represent log10 dilutions of samples. N, 10% NBH treated with PK. Lanes labeled with a plus sign contain a −1-log10 dilution of positive-control samples (same samples as the −1 log10 control in the left column). Molecular weights of 37,000 and 25,000 are indicated on the far left and right.

