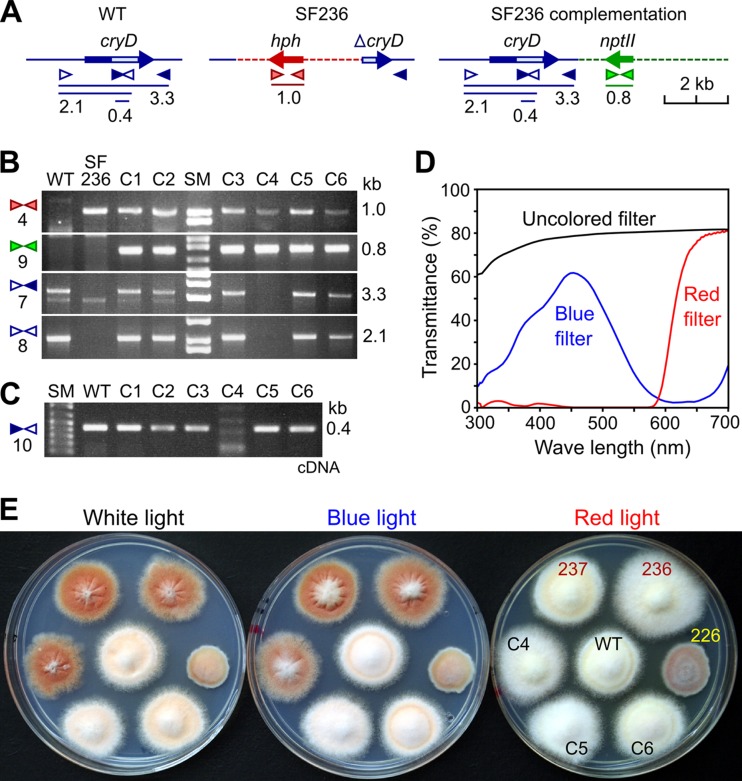
Fig 6.
Complementation of the ΔcryD phenotype. (A) Schematic representation of primer locations and PCR products (sizes in kb) for the cryD gene in the wild type (WT), the hph-disrupted allele in the ΔcryD mutant SF236, and the construct added to SF236 in the transformation experiment. The light box in the cryD gene represents the predicted FAD binding domain. (B) Agarose gel electrophoresis of PCR amplification products obtained from genomic DNA samples of the wild type (WT), the ΔcryD mutant SF236, and the SF336-derived transformants C1 to C6. Primer sets are numbered on the left according to Table 1. Expected PCR products are indicated on the right. The 1-kb band (primer set 4) and the 0.8-kb band (primer set 9) indicate the presence of the hph and nptII genes, respectively. The 2.1- and 3.2-kb bands indicate the presence of the 5′ cryD sequence or the entire cryD sequence, respectively. (C) Agarose gel electrophoresis of the PCR amplification products obtained with primer set 10 from cDNA samples of the wild type (WT) and the complementation transformants C1 to C6 after 1 h of exposure to light. The 0.4-kb product indicates the presence of cryD transcript. (D) Transmittance spectra of cellophane sheets used as filters for illumination with white light (uncolored filter), blue light (blue filter), and red light (red filter). (E) Visual phenotype of the wild type (WT), the ΔcryD mutants SF236 and SF237, the ΔwcoA mutant SF226, and the transformants C4, C5, and C6 grown upon illumination with white, blue, or red light (see transmittance spectra).

