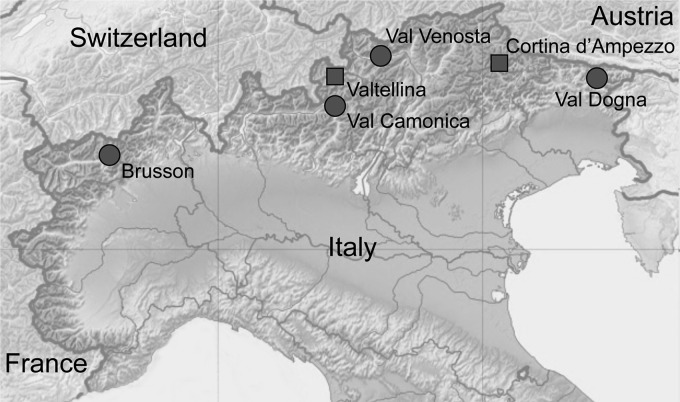
Fig 1.
Map of the sampling sites of outbreak populations (squares) and nonoutbreak populations (circles) of Ips acuminatus. The base map is modified from a Wikimedia Commons file originally created by Eric Gaba and NordNordWest and republished under the Creative Commons Attribution-Share Alike 3.0 Unported license.

