
Fig 3.
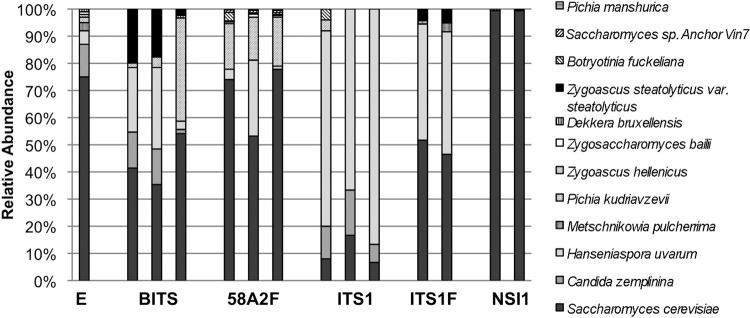
Taxonomic distribution of OTUs detected in a single yeast mock community reveals differential bias of ITS primer sets. Shown is the HTS community structure of a defined yeast mock community amplified with five different paired ITS primers. E, expected.